


Welcome to Markets 4x4, post delivered daily by 4pm in Sydney detailing the key macro themes from the Asian session.
Here’s what you need to know for Thursday, November 2.
Doesn’t get much bigger than this for S&P 500
You don’t get many occasions as important for the US S&P 500 than one coming up today, at least from a technical perspective. Having broken above 4200, the index is now staring an equally important level, the 200-day moving average, square in the face. RSI and MACD are threatening to break their respective downtrends, adding to the sense momentum is turning. Bond yields are substantially lower, futures are up 0.3% as this scribe types away. And in enters Apple’s Q3 earnings report after the closing bell on Wall Street.
Given the sheer weight of Apple in the index, and the reaction function it may have across other big tech names and the vast array of suppliers, this event looms as even more important than usual, potentially changing the technical picture heading into what traditionally a seasonally strong period for stocks.
Perhaps the two Bill’s were right on bonds?
On the question whether demand will be sufficient to absorb a strong pipeline of new US Treasury issuance in the months ahead, US real yields are giving off a strong signal that it is, for now.
Over the past month, US benchmark 10-year yields rose above 2.5% on six separate occasions but failed to stay there, including on Wednesday. As this reflects the yield pickup over that offered by inflation protected securities for the same maturity, it suggests bond investors believe they’re receiving adequate compensation given a multitude of risks. Things can change, of course, but perhaps we’ve seen the highs for now. Maybe Ackman and Gross were right when they ditched their bear suits tune last week?
AUD/USD looking good for risk appetite
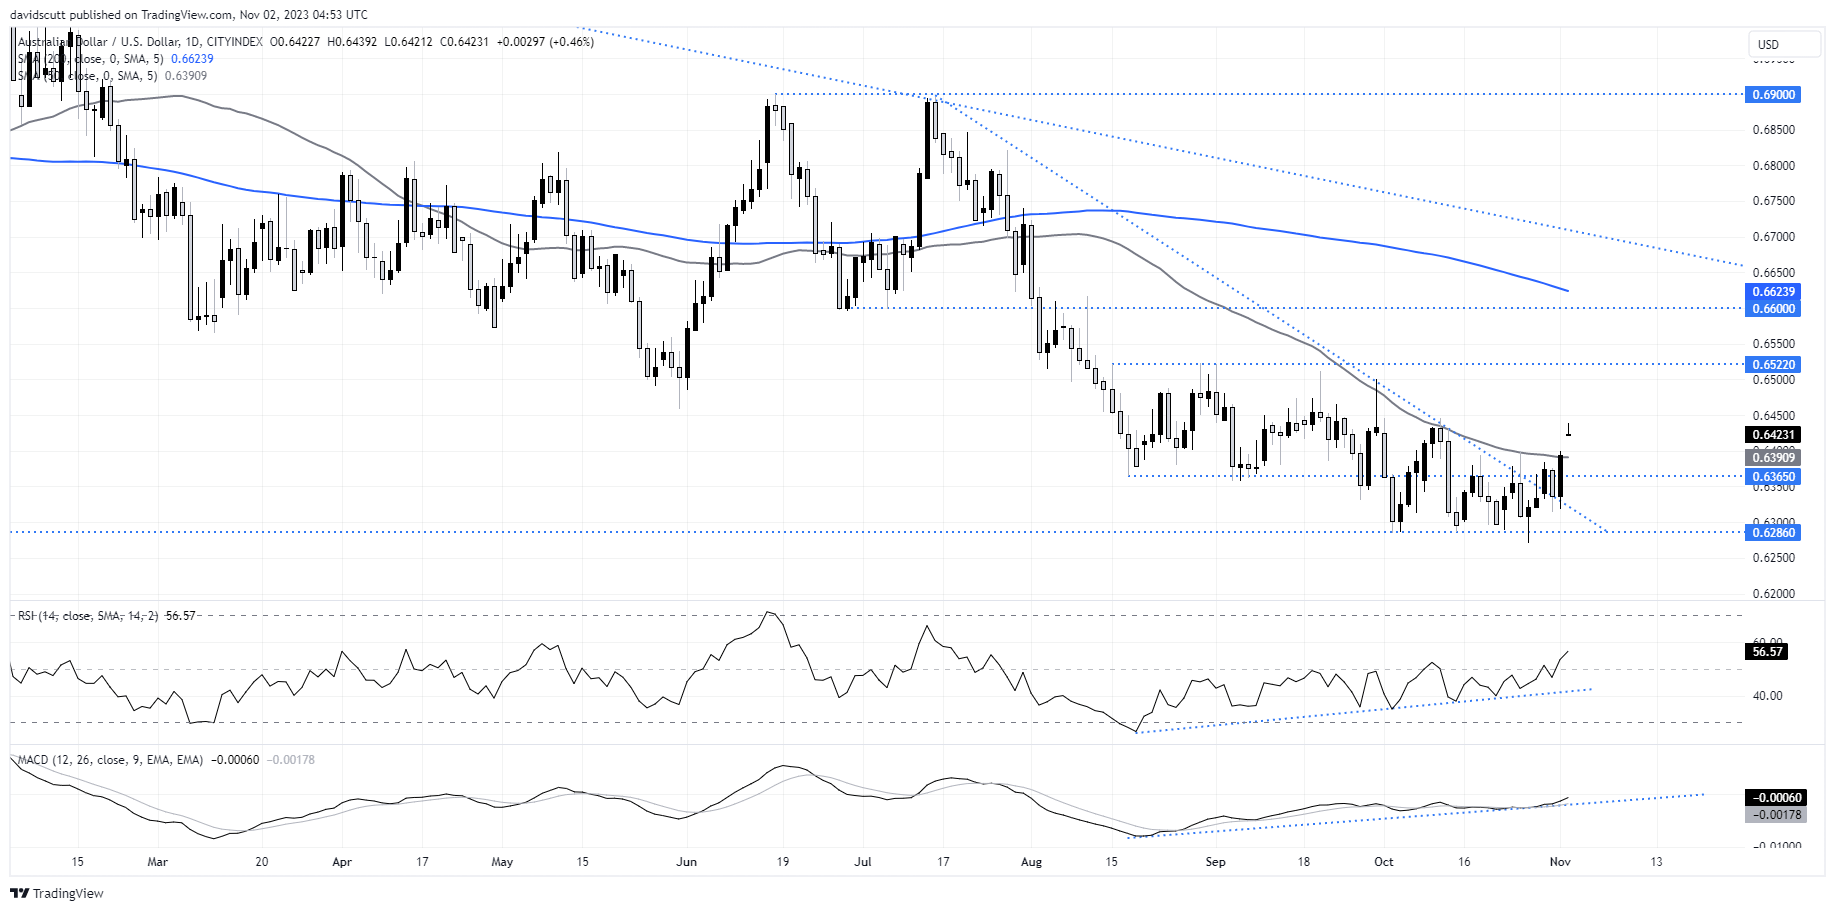
The Australian dollar is deemed a proxy for a variety of different things, depending on who you talk to. Sentiment towards China, the global economy, and even investor risk appetite. Well, whatever it is, the AUD/USD is suddenly looking alright on the charts.
Having broken the downtrend running from July earlier this week, it’s now battled its way through the 50-day moving average, a nemesis it’s not been able to conquer since August. Until now, that is. While we’re not getting carried away – it’s only sitting at three-week highs – perhaps this extremely liquid FX pair is telling us the outlook for other riskier asset classes is turning? It has done so in the past.
Japan wins big with timing of bond auction
Remember when everyone was talking about the Bank of Japan, FX intervention and emergency bond buying operations? Yeah, good times. You wouldn’t believe it, but that was only yesterday. Things are moving fast.
After probably losing his voice yesterday with all the warnings about intervening and speculative moves, Japan’s FX Tsar Kanda was nowhere to be seen today with USD/JPY and Japanese bond yields unwinding rapidly over the course of the session.
On the latter – bond yields – the Japanese government should go buy a lottery ticket, scheduling an auction of benchmark 10-year bonds on the very day we’ve seen the largest decline in global yield curves in months. While the tail was a tad longer than the prior auction, indicating marginally softer demand, it could have been a whole lot worse if the environment wasn’t so benign. Talk about hitting the jackpot!
Market of the day: USD/JPY
All right, since we’re on Japan, let’s have a look at USD/JPY to finish off. What a ride over the past 48 hours! A near 300 pip round trip only to be roughly back where it was trading prior to very precise leaks from one media outlet about potential changes to the Bank of Japan’s yield curve control.
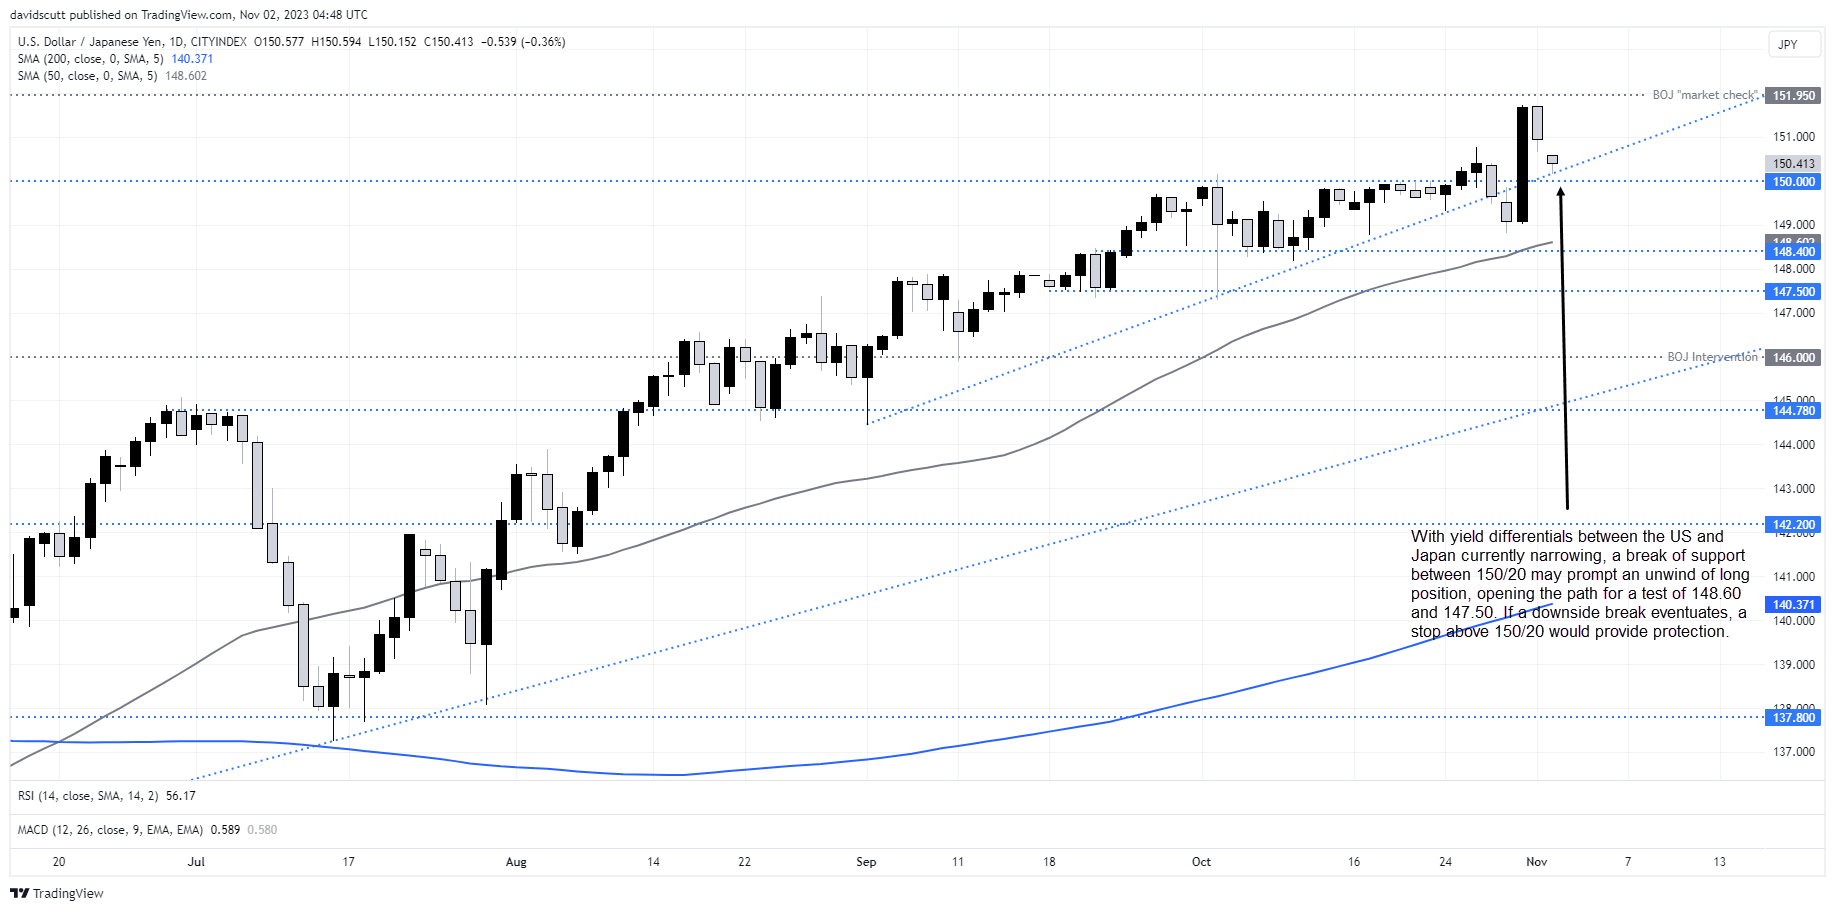
USD/JPY is sitting on uptrend support that was only broken temporarily by the BOJ announcement and remains above the 150 level. However, considering how influential interest rate differentials have between the US and Japan have been on the pair, it’s noticeable that spread in 10-year yields between the two nations has narrowed to the lowest level in about a month, declining around 35 basis points from the highs. That was when USD/JPY was trading closer to 149 than 150.40, suggesting on that metric alone, perhaps downside risks may be building.
A break of support between 150 and 150.20 may lead to further unwinding of longs, putting 148.60 and 147.50 potentially into play. A stop above the uptrend support would offer protection, should the pair break lower.
-- Written by David Scutt
Follow David on Twitter @scutty
How to trade with City Index
You can trade with City Index by following these four easy steps:
-
Open an account, or log in if you’re already a customer
• Open an account in the UK
• Open an account in Australia
• Open an account in Singapore
- Search for the market you want to trade in our award-winning platform
- Choose your position and size, and your stop and limit levels
- Place the trade
Latest market news
Yesterday 01:32 PM
Yesterday 09:35 AM
Yesterday 07:23 AM
Yesterday 04:48 AM
Yesterday 12:17 AM
July 25, 2024 10:39 PM
Latest FX articles

July 25, 2024 04:37 AM

July 6, 2024 02:00 PM

June 24, 2024 12:29 PM

June 16, 2024 11:58 PM