


As September begins, we find ourselves in an interesting macro environment. Traders are weighing the likelihood of a recession against the prospect of "higher for longer" Fed rates.
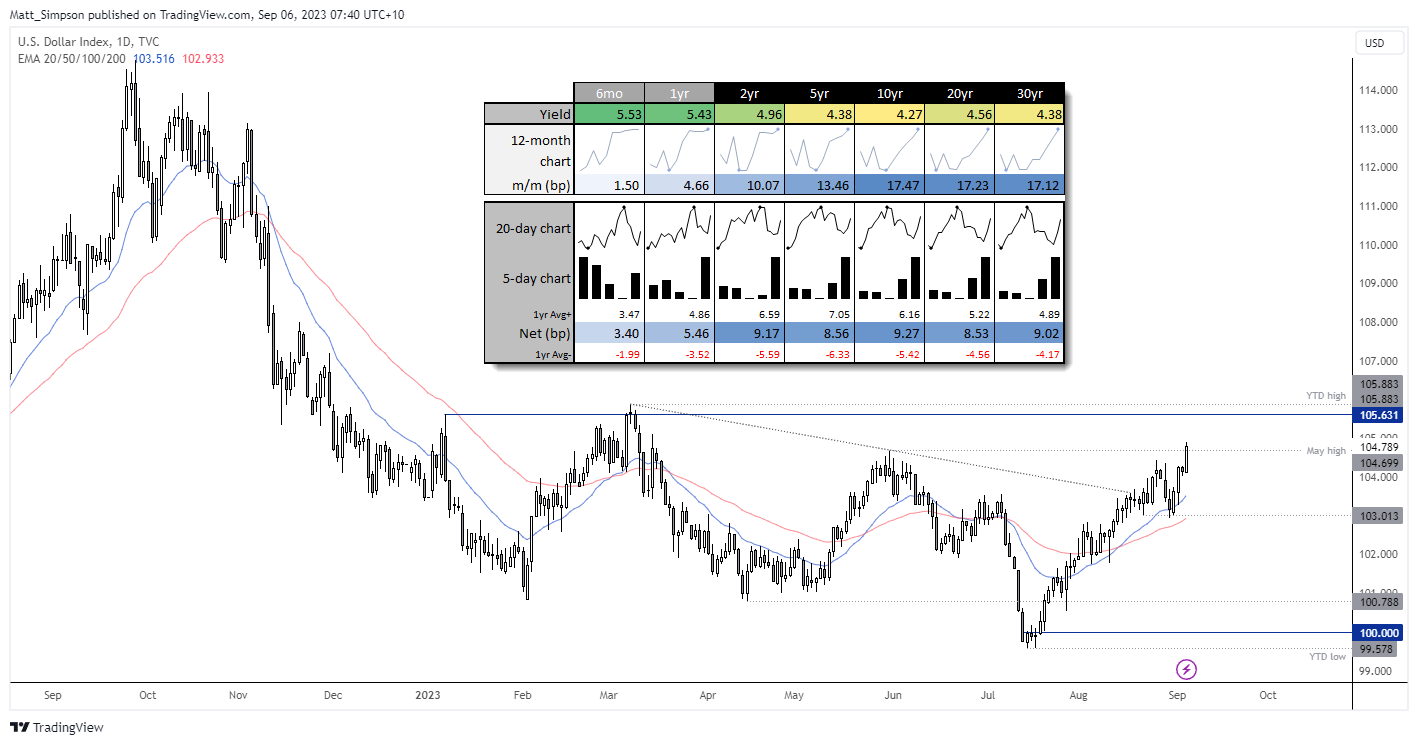
US bond yields have continued to surge this week, dragging the US dollar higher on concerns of a global slowdown. Softer employment data from the US, another round of weak PMI figures from China and Europe have seen the US dollar attract safe-haven flows, while bond investors demand a higher yield to compensate for the risk of a potential recession.
And thanks to the extended oil production cuts from Saudi Arabia and Russia, WTI crude oil is closing in on $90, renewing concerns about another round of inflation.
This sent the US dollar index to a 17-month high on Tuesday, and all US yields above 6 months continued higher. Yet while this weighed on gold prices, one could argue that it held up relatively well despite the dollar's strength.
Is gold still a safe-haven?
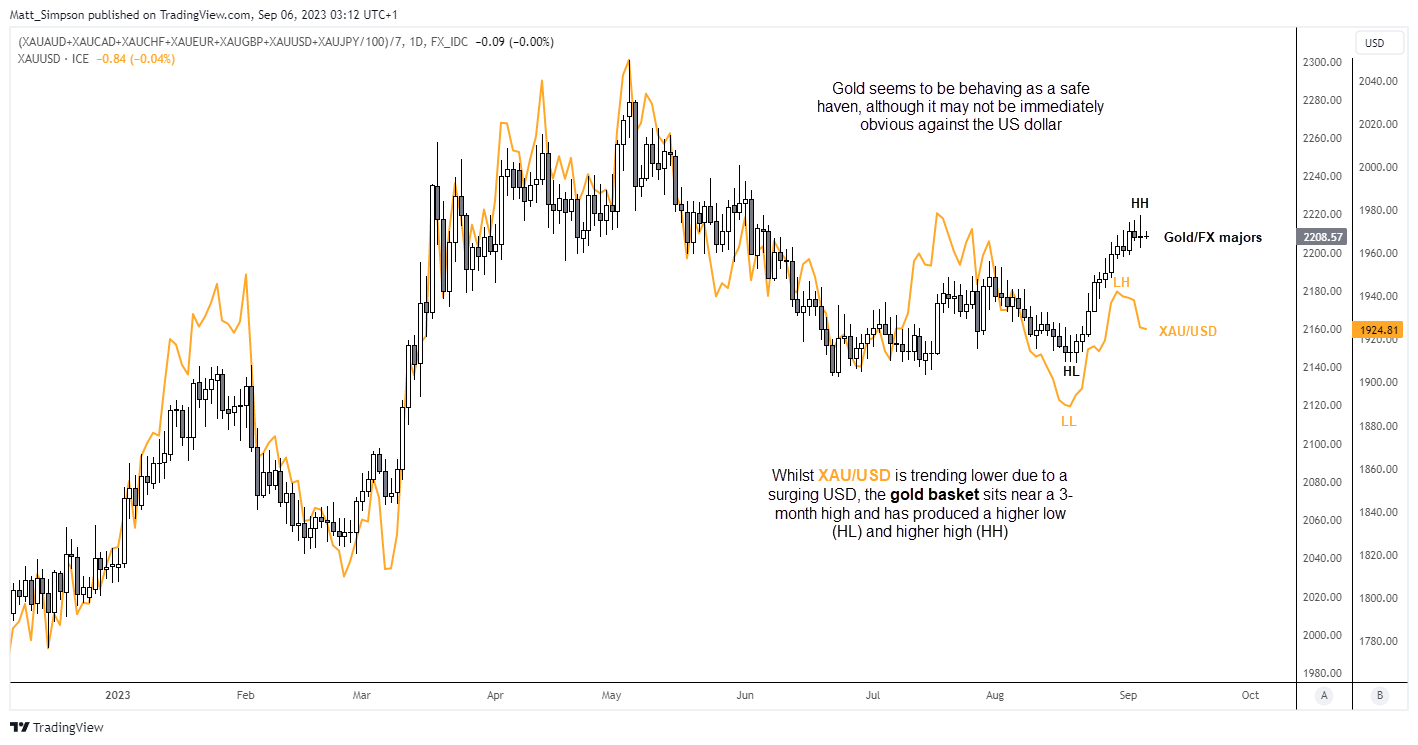
Despite competing with the strength of the dollar, gold has been trading higher against all other major currencies since its low in August. This suggests that gold is acting as a safe haven, even if it is not immediately obvious from the XAU/USD chart.
The chart below shows an equally-weighted gold basket against the classic XAU/USD spot chart. Although these two charts typically move in tandem to show the overall strength or weakness of gold, there is a slight divergence emerging, indicating that the weakness in XAU/USD is primarily due to a stronger US dollar.
And concerns of a global slowdown simply add to the case for the Fed to hold rates in September, further provides a degree of support for gold. And with the 200-day average sitting around 1920, it could find a level of support over the near-term, unless yields continue to surge higher.
Gold technical analysis (daily chart):
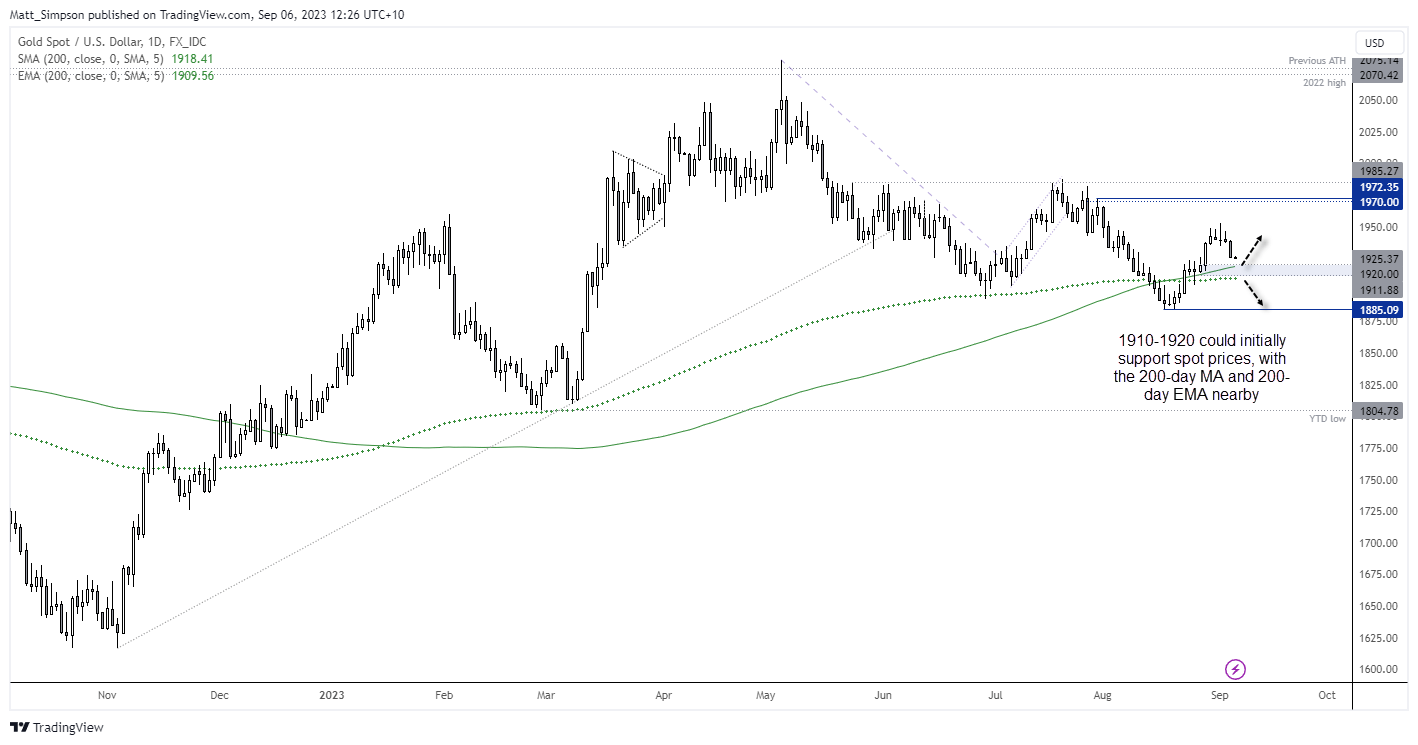
Momentum has turned lower for gold against the dollar, but there are some key levels of support nearby which could at least slow any bleeding. The 200-day EMA sits around 1910 and the 200-day average just below 1920, which makes the 1910-1920 zone a likely level of support over the near-term. Of course, if the rally on yields and the US dollar peters out, it could certainly help build a case for gold prices to bounce against the dollar.
Should prices build a base above the 1910-1920 zone, perhaps it could muster up a bounce to the 1940-1950 region, but for now I’ll revise lower my original expectation of a simple rally to 1970. A break beneath 1910 brings 1900 and the 1985 low into focus for bears.
Gold technical analysis (1-hour chart):
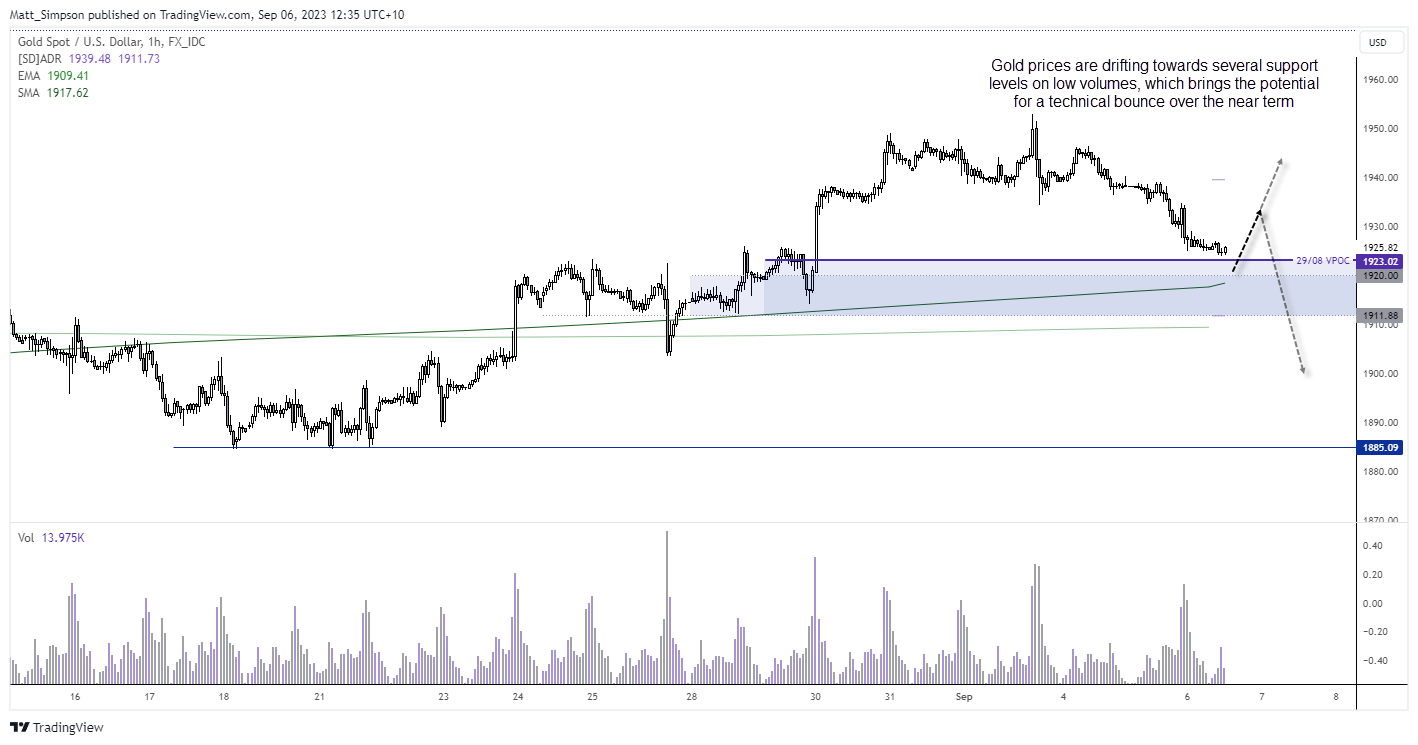
The 1-hour chart shows gold prices are drifting lower towards several support levels on relatively low volumes, which brings the potential for a technical bounce over the near-term. At 1923.3 we have an untested daily VPOC (volume point of control) and of course the round number 1920 nearby. 1930 or the pivotal level around 1934 could be a viable near term target for bulls, at which point we’d like to reassess its potential to continue higher or form a swing high on this timeframe.
-- Written by Matt Simpson
Follow Matt on Twitter @cLeverEdge
How to trade with City Index
You can trade with City Index by following these four easy steps:
-
Open an account, or log in if you’re already a customer
• Open an account in the UK
• Open an account in Australia
• Open an account in Singapore
- Search for the market you want to trade in our award-winning platform
- Choose your position and size, and your stop and limit levels
- Place the trade
Latest market news
Yesterday 10:44 PM
Yesterday 05:00 PM
Yesterday 03:13 PM
Yesterday 01:39 PM
Latest Trade Ideas articles


Yesterday 10:44 PM


Yesterday 05:00 PM