- What is a gearing ratio?
- Types of gearing ratios
- How to calculate a gearing ratio
- Gearing ratio formulas
- What does the gearing ratio show us?
- What is a good gearing ratio?
- Ways companies manage their gearing ratio
What is a gearing ratio?
A gearing ratio is a type of financial ratio that compares a company’s debt to other metrics, such as equity or assets. It’s used to measure a company’s leverage, which shows how much of a company’s operations are funded by equity compared to debt.
There are a few types of gearing ratios, which we’ll get into the formulas of in a moment, but they’re all used to get clarity into the source of a firm’s funding. This can provide us with a key indicator of how well a company will be able to withstand periods of financial instability and economic downturn.
The gearing ratio is an indicator of financial risk. While the use of debt or leverage on its own is not a cause for concern - most companies at one time or another will need to use loans to fund expansions and other projects - the risk comes if a company has too much debt that it’s unable to pay off. This means it’s more likely to fall into financial distress and may even be at risk of bankruptcy.
Types of gearing ratios
There are a number of types of gearing ratios that can be used to assess a company. Three common examples are:
- Debt-to-equity ratio
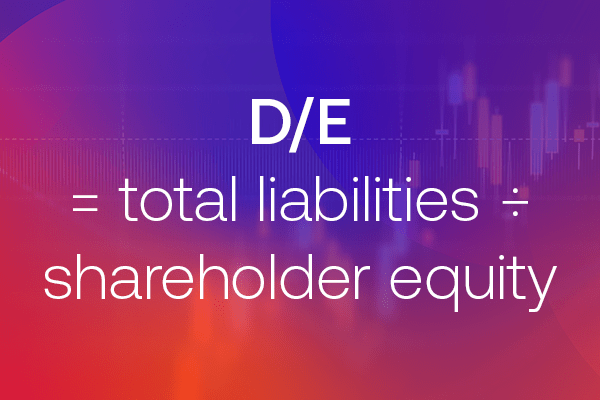
This is the most common gearing ratio, known as the D/E ratio, which compares a company’s total debt against its shareholder equity. It provides insight into how a company’s operations are funded and how capable the firm is of paying its current debts
- Equity ratio
This gearing ratio measures the amount of leverage used by a company by looking at how it invests in assets and the amount of equity it has. This gives insights into how well a company manages its debts and how it funds any asset requirements
- Debt ratio (debt-to-asset ratio)
This financial metric helps investors understand how much a company’s operations are funded by debt. The debt-to-asset ratio looks at interest-bearing liabilities - such as bonds, term loans from a commercial bank, or subordinated debt - rather than total liabilities (like accounts payable)
There are other ratios that can be used to understand leverage. Learn about other financial ratios.
How to calculate a gearing ratio
- Choose the type of gearing ratio (for example, D/E ratio or equity ratio)
- Read the company’s earnings report to find the figures you need (debt, equity and assets)
- Use the formulas below to calculate your gearing ratio
Calculating a gearing ratio ultimately depends on which type you want to use, as the formulas vary. All gearing ratios measure debt against a secondary metric, the most common two are equity and assets.
So, for all of them, you’ll need to first identify a company’s debt level by finding the sum of a company’s long-term debt, short-term debt and any bank overdrafts - all of these figures should be on the firm’s latest earnings report.
Learn how to read an earnings report.
Once you know the total debt, you’ll also need to know what you’re comparing it to. This can require a bit more research into a company’s financials. For example, you might need to calculate the total shareholder equity, which is the net worth of a company or the total amount that would be returned to shareholders if a company’s assets were liquidated.
How to trade shares with City Index
Gearing ratios can change how investors view a company’s stock, which can create movement in its share price. You can speculate on thousands of shares with City Index in just four easy steps:
- Open a City Index account, or log in if you’re already a customer
- Search for the company you want to trade in our award-winning platform
- Choose your position and size, and your stop and limit levels
- Place the trade
Or you can start share trading risk free by signing up for our demo trading account.
Gearing ratio formulas
As mentioned, the gearing ratio formula will vary depending on the exact measure you’re looking at.
Debt-to-equity ratio formula
The debt-to-equity ratio formula is:
D/E = total liabilities ÷ shareholder equity

The ratio is expressed as a percentage and tells us how much outstanding debt could be paid by existing equity.
- A high D/E ratio - typically greater than 50% - means the company has a larger proportion of debt than equity, so would not be able to pay down its debt
- A normal D/E ratio is usually between 25-50%, it shows a balance of equity and debt which is typical for most companies going through expansionary periods
- A low D/E ratio - less than 25% - indicates that the company has a smaller proportion of debt to equity and could pay liabilities if required. It’s considered a lower risk
Debt ratio formula
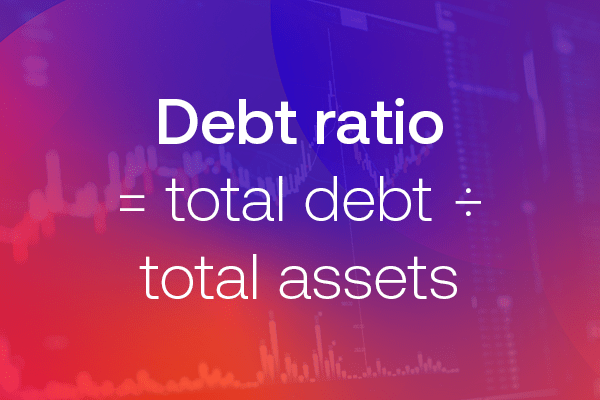
Instead of looking at equity, the debt ratio is a measure of a company’s total debt against its total assets, expressed as a decimal or percentage. It shows us how much of a company’s assets are financed by its debt.
The debt ratio formula is:
Debt ratio = total debt ÷ total assets

A debt ratio of less than 1 or 100% would tell us that a greater portion of the company’s assets is funded by equity than by debt, while a debt ratio greater than 1 or 100% would indicate that the company has more liabilities than assets. This could mean it’s at a greater risk of defaulting on its loans if interest rates were to suddenly be raised.
Equity ratio formula
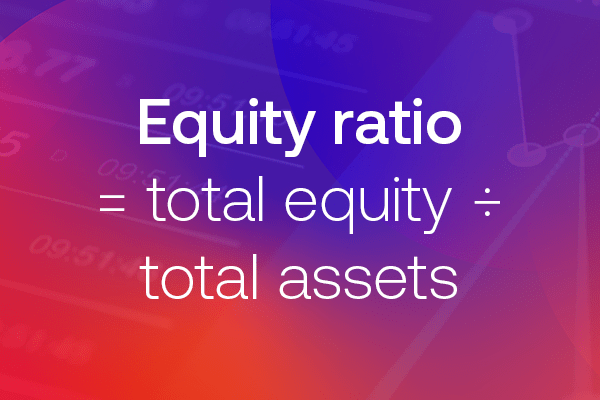
The equity ratio formula doesn’t use debt at all. Instead, it looks at equity and asset responsibilities to assess how a company meets any obligations. For example, if its assets are greater than its equity, it would need to use debt to fund the difference.
The equity ratio formula is:
Equity ratio = total equity ÷ total assets

A company with an equity ratio that is 0.50 or below is considered a leveraged company - in that it uses debt to finance its assets. On the flip side, a ratio of 0.50 or above is considered a more conservative company, as they get more of their funding from shareholder equity than debt. The higher the value, the less leveraged the company is.
What does the gearing ratio show us?
When a company has a high gearing ratio, it indicates that a company’s leverage is high, which makes it more susceptible to any economic downturns. A company with a low gearing ratio is generally considered more financially sound, so may attract more investment as a comparatively safe option.
For investors, the gearing ratio also shows whether a company is already paying high amounts of interest to any lenders. If it is, they may be reluctant to invest their money, given the length of time it could take to get a return.
What is a good gearing ratio?
A good gearing ratio depends on the industry the company sits in. While some gearing ratios above 50% are considered high risk, and others say above 100% is high risk, that figure still depends on the context it sits in.
For example, a company with a gearing ratio of 60% may be perceived as high risk on its own. But if other companies in the same industry have a 70% gearing ratio, and there’s an industry average of 80%, then the original company with a 60% ratio is performing well by comparison.
A lot of industries where high gearing ratios are common are those that are considered high growth - such as the tech industry. It’s not surprising for companies to take on debt in order to expand rapidly.
Ways companies manage their gearing ratio
Investors won’t just be looking at a company’s gearing ratio, they’ll be taking note of how the management team intends to manage debt levels in the future.
As we’ve seen, a high gearing ratio doesn’t necessarily need to concern investors, particularly if it’s sat in a high-growth industry. But companies still need a plan in place to encourage investment.
Companies looking to reduce their gearing ratio to a more attractive level will:
- Try to boost margin by maximising profit and minimising costs
- Use profit to pay down long-term debts
- Reinvest profit in the company, rather than paying dividends
- Issue more shares via secondary offerings and stock splits
You should also keep an eye out for actions that could increase a company’s gearing ratio, potentially opening them up to instability in the longer run. These include:
- Focusing on boosting revenue rather than profit (not managing costs efficiently)
- Converting short-term debt into longer-term loans
- Buying back shares
- Issuing preference shares or debentures
Gearing ratio summed up
- A gearing ratio is a type of financial ratio that compares a company’s debt to other metrics, such as equity or assets
- Gearing ratios are used to get clarity into the source of a firm’s funding - be that debt or equity
- Examples of gearing ratios include the debt-to-equity ratio (D/E ratio), equity ratio and debt-to-asset (debt) ratio
- Calculating a gearing ratio ultimately depends on which type you want to use, as the formulas vary
- The gearing ratio formula will vary depending on the exact measure you’re looking at
- Everything you need to calculate a gearing ratio can be found in a company’s earnings report and balance sheet
- When a company has a high gearing ratio, it indicates it’s leveraged - meaning it funds its assets and liabilities through debt not equity. This can mean it’s more susceptible to economic downturns
- A company with a low gearing ratio is considered more financially sound, as it has enough equity to pay its liabilities and asset requirements, so may attract more investment
- A good gearing ratio depends on the industry the company sits in. For example, high-growth industries may have higher average gearing levels
- You should keep an eye out for actions that could decrease and increase a company’s gearing ratio, as this can alter the sentiment towards its stock


