


Asian Indices:
- Australia's ASX 200 index rose by 19.4 points (0.26%) and currently trades at 7,357.40
- Japan's Nikkei 225 index has risen by 269.32 points (0.84%) and currently trades at 32,473.65
- Hong Kong's Hang Seng index has fallen by -29.76 points (-0.15%) and currently trades at 19,216.27
- China's A50 Index has fallen by -16.51 points (-0.13%) and currently trades at 13,154.10
UK and Europe:
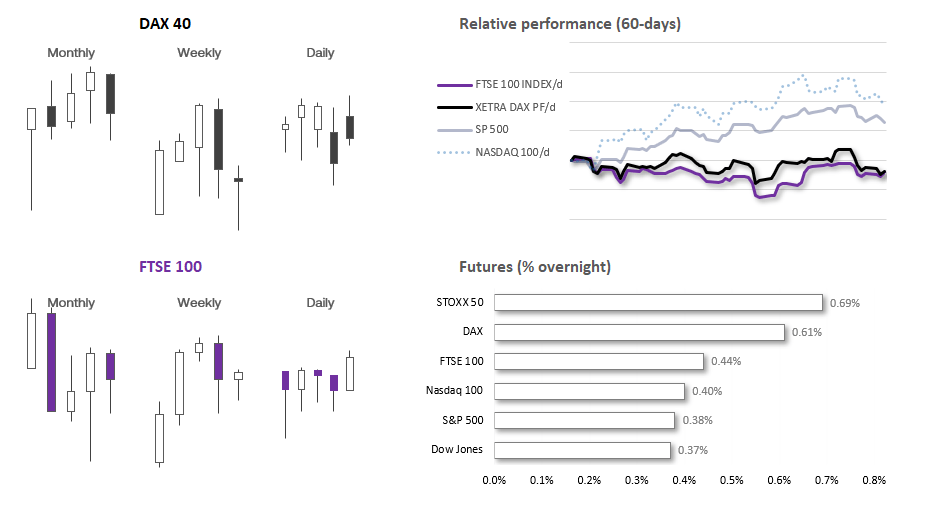
- UK's FTSE 100 futures are currently up 43 points (0.57%), the cash market is currently estimated to open at 7,630.30
- Euro STOXX 50 futures are currently up 36 points (0.83%), the cash market is currently estimated to open at 4,353.33
- Germany's DAX futures are currently up 101 points (0.64%), the cash market is currently estimated to open at 15,953.58
US Futures:
- DJI futures are currently up 149 points (0.42%)
- S&P 500 futures are currently up 19.75 points (0.44%)
- Nasdaq 100 futures are currently up 74.25 points (0.49%)
The day has finally rolled around for today’s US inflation report, which likely has the power to sway the Fed’s next interest rate decision. Understandably, rising energy prices of the past few weeks has many concerned over a second wave of inflation, and the ‘basing effect’ also has many on guard for a hotter inflation print today. The contrarian in me now wonders whether there maybe disappointment, which could weigh on the US dollar and yields whilst providing a mini risk-on rally for US indices, gold and commodity pairs such as AUD/USD and NZD/USD (although the US dollar would likely be lower against all major markets if inflation came in surprisingly soft).
The consensus estimate for CPI is for it to rise to 3.3% y/y from 3.0% prior. This is partly because prices have declined for 12 consecutive months since the peak, so it would need to decelerate quite fast to not slow its pace of disinflation. However, oil has surged over 25% in recent weeks and natural gas is up over 50% from its lows, so inflationary forces are building which are due to seep into headline inflation figures in coming weeks or months. Core CPI is the key gauge to watch and is expected to remain at the high level of 4.8% y/y and 0.2% m/m. Any uptick on either the annual or monthly metric could boost the US dollar as traders price in another hike for the Fed's September meeting. But with so many people expecting higher inflation, anything short of that outcome could see markets breathe a sigh of relief and weigh on the US dollar, sparking a mini risk-on rally.
It is worth noting that 1-day implied volatility levels for FX majors have blown out relative to their 20-day average, particularly for USD/CHF, USD/CAD, and EUR/USD which are around twice the usual level. This suggests that markets are expecting a volatile reaction to the inflation report, with the potential for significant moves in the US dollar and other currencies.

Gold 1-hour chart:
Gold hasn’t played well with my earlier bias this week, which was looking for a base above 1935 or 1930 at a push. It has traded lower for three consecutive days, and now with a day or two’s daily range from testing the key level of 1900. Whilst a strong print could knock gold down towards (or even to) 1900, a weak inflation report could see bears capitulate around these cycle lows.
The 1-hour chart remains within an established downtrend, which means bears need a hot inflation print to justify their recent shorts. Volumes have risen during the three recent legs lower, and the latest swings lower have been accompanied with negative delta tick volume (higher bearish volume and bullish) which leaves these bears vulnerable to short covering if the data does not go their way.
The Asian high met resistance at the weekly S1 pivot and daily pivot point, so the 1920.43 – 1921.56 zone could be a pivotal level (bears could seek to fade into it, or cover and switch to longs if we break above it with enough conviction).

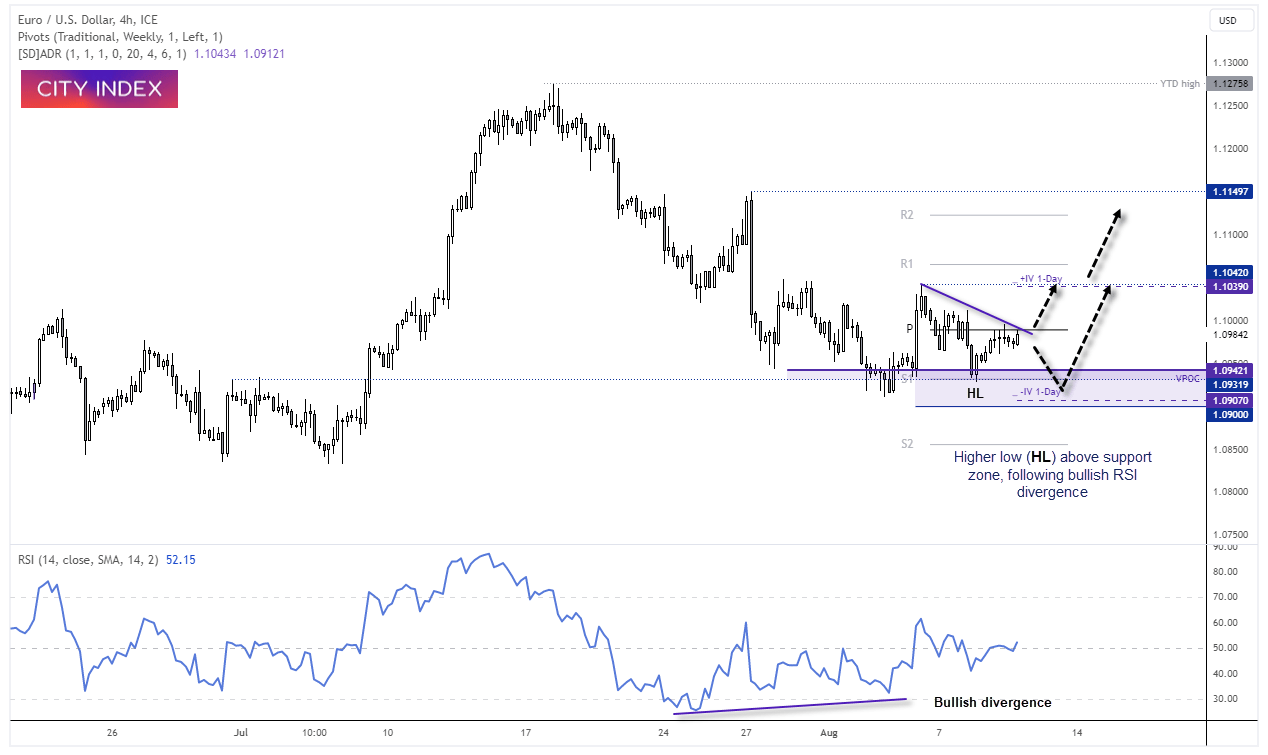
EUR/USD 4-hour chart:
Price action on the EUR/USD daily chart has been choppy these past few days, but I stand by my earlier assumption that the decline from the July high needs a technical bounce higher (at a minimum). Despite the choppiness, prices have mostly held above a weekly VPOC, allowing a bullish RSI divergence to form ahead of a higher low (HL) on the 1-hour chart.
The Asian session formed a high around the weekly pivot point and momentum is trying to turn higher ahead of the European open, making the 1.0988 – 1.1000 area an important (and likely) pivotal zone this coming session. Clearly, we’d need a softer-than-expected inflation report to get a rally on EUR/USD (and gold) started, but with markets positioned for hot inflation already then perhaps it is not such a crazy expectation. And until we see a decisive break below 1.0900, I’ll stick to my contrarian guns and assume this market wants to trade higher. And whether today’s CPI report will be the catalyst or not remains to be seen.
View the full economic calendar
-- Written by Matt Simpson
Follow Matt on Twitter @cLeverEdge
How to trade with City Index
You can trade with City Index by following these four easy steps:
-
Open an account, or log in if you’re already a customer
• Open an account in the UK
• Open an account in Australia
• Open an account in Singapore
- Search for the market you want to trade in our award-winning platform
- Choose your position and size, and your stop and limit levels
- Place the trade
Latest market news
Yesterday 10:44 PM
Yesterday 05:00 PM
Yesterday 03:13 PM
Latest Trade Ideas articles


Yesterday 10:44 PM