


October 12, 2021 8:38 PM

EUR/USD continues to make lower lows and lower highs. And that, by definition, is a downtrend. However, it may not have as much to do with the Euro, and it has to do with the US Dollar. The US Dollar Index broke out of a short-term symmetrical triangle near 94.40 and is desperately trying to push above a long term trendline (red) dating back to 2011. Price halted at the trendline, hear 94.56 as it moves towards the September 24th, 2020 highs of 94.76.
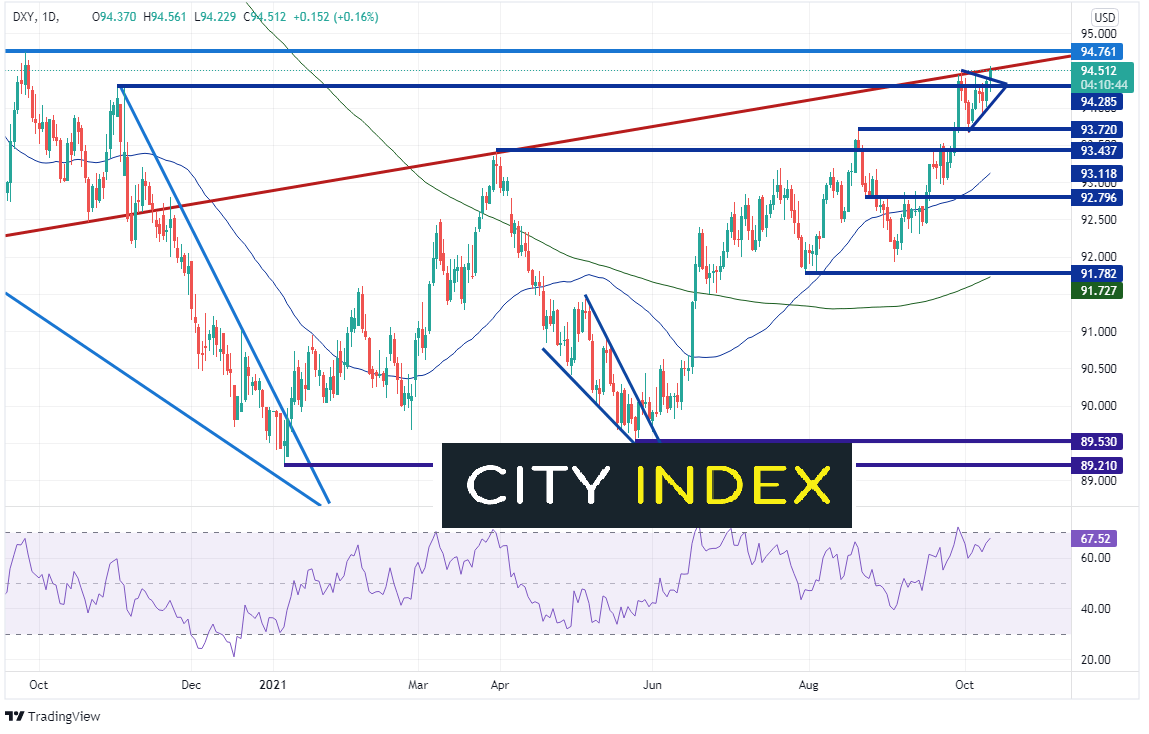
Source: Tradingview, Stone X
What is the US Dollar Index (DXY)?
EUR/USD makes up 57% of the US Dollar Index (DXY), so it’s no surprise that as the DXY pushes towards new highs, that EUR/USD is moving in a similar, but opposite, direction. Today, the pair reached a low of 1.1524 thus far, its lowest level since July 21st, 2020. Price formed a double top near 1.1905 back in August and September, and finally broke lower on September 29th. The target for the double top is near 1.1400, however price must first pass through strong support between 1.1490 and 1.1515, which is:
- The 161.8% Fibonacci retracement from the August 20th lows to the September 3rd highs
- The 50% retracement level from the March 2020 lows to the January 6th highs
- Horizontal support dating back to spike highs from March 2020
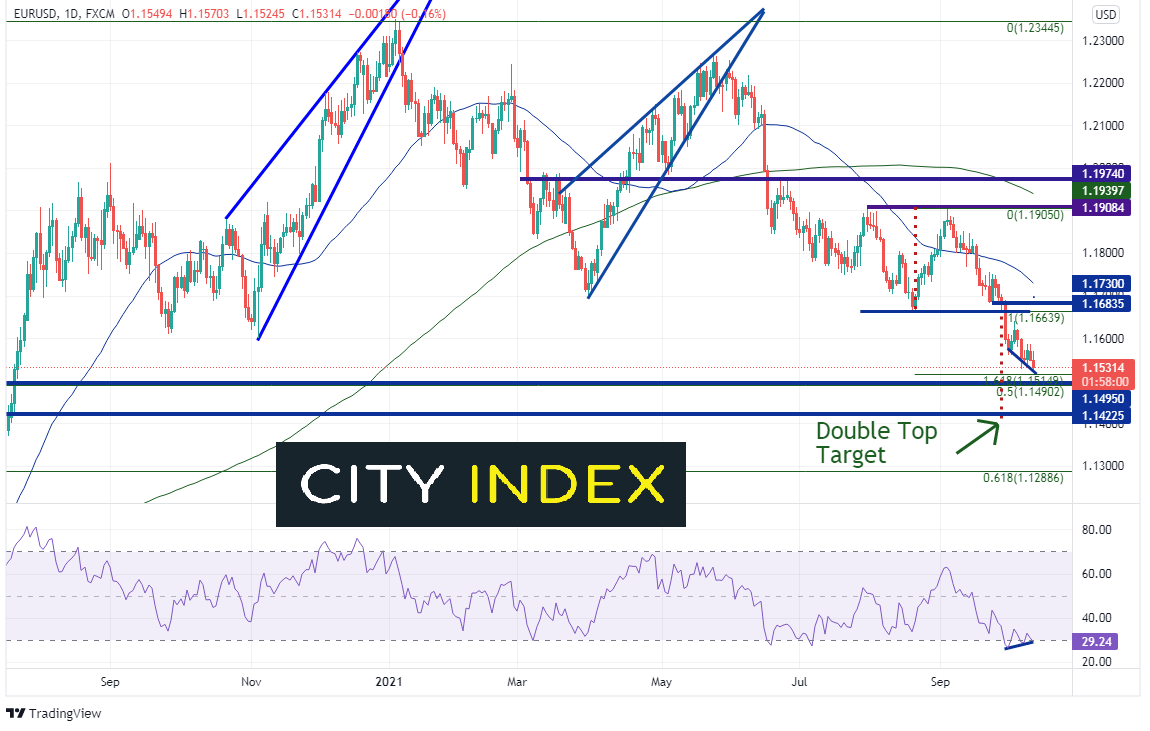
Source: Tradingview, Stone X
Notice also that the RSI is diverging from price, an indication that price may be ready for a bounce.
Trade EUR/USD now: Login or Open a new account!
• Open an account in the UK
• Open an account in Australia
• Open an account in Singapore
On a 240-minute timeframe, the downtrend is much more noticeable within the channel. In addition to the support mentioned above as price moves towards the double top target, there is also currently support at the bottom trendline of the downward sloping channel near 1.1460. Resistance is above at the top downward sloping trendline near today’s highs of 1.1570. If price breaks above, there is resistance at the neckline of the double top near 1.1665 and then the 50-Day Moving Average (see daily) near 1.1730.
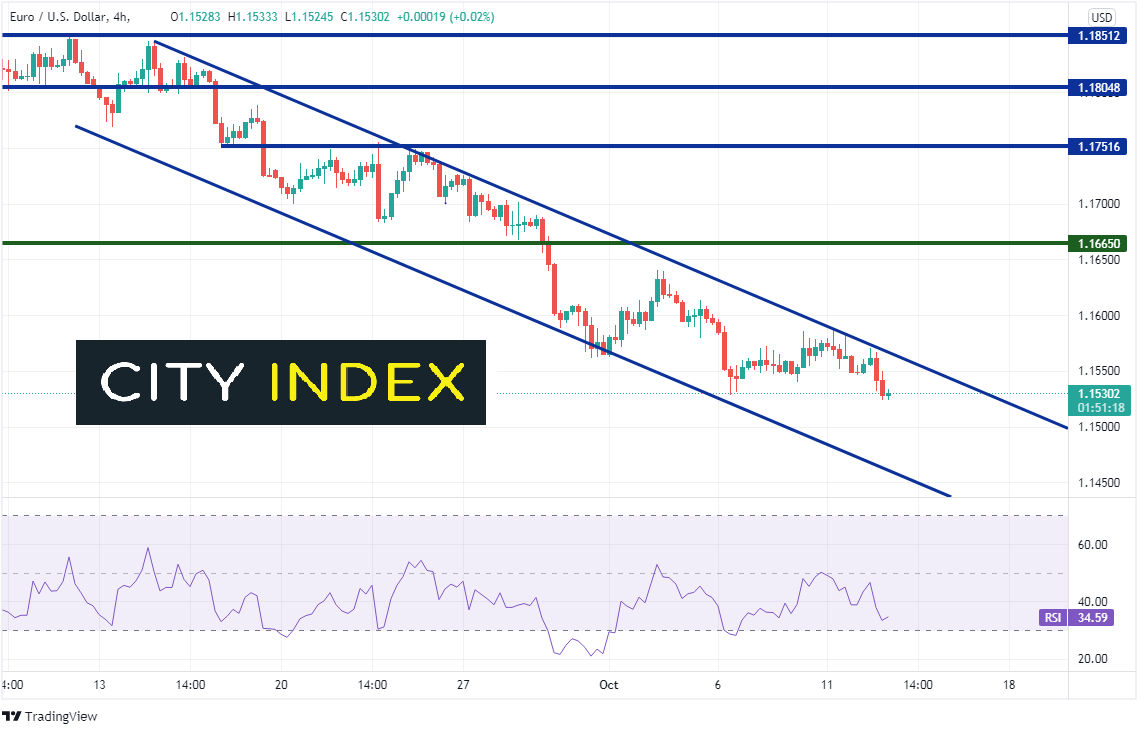
Source: Tradingview, Stone X
EUR/USD has reached its lowest level since July 21st, 2020. However, note that it’s probably not all due to the Euro. Given the Euro makes up 57% of the DXY, it seems much of the reason for the new lows is because DXY is putting in new yearly highs!
Learn more about forex trading opportunities.
Latest market news
Yesterday 01:32 PM
Yesterday 09:35 AM
Yesterday 07:23 AM
Yesterday 04:48 AM
Yesterday 12:17 AM
July 25, 2024 10:39 PM
Latest EUR/USD articles

July 25, 2024 03:59 PM

July 24, 2024 12:52 PM

July 24, 2024 09:11 AM

July 22, 2024 09:30 AM