


DJIA Key Points
- The Dow closed higher for the 8th consecutive day to hit a record high, an event that we’ve only seen 42 times in the index’s 127-year history.
- Historical returns following past 8-day winning streaks to record highs have been above average over the next 1-3 months, but more mixed over the next year.
- The DJIA is overbought and could see a short-term pullback toward 37K or 36K before resuming its longer-term uptrend.
DJIA Historical Analysis
Many analysts prefer to look at the broader S&P 500 or the more “modern” Nasdaq 100 as a better gauge of US stock market performance than the stodgy old Dow Jones Industrial Average, but there’s one advantage to the DJIA that no one can deny: Its LONG history.
The DJIA was first created in 1896 by, you guessed it, Charles Dow and originally consisted of 12 industrial giants. While the index has expanded and the companies within it have changed, the DJIA is still by far the US stock market index with the longest history, making it fertile ground for historical analysis.
Specifically, yesterday marked a relatively rare bullish signal: The Dow closed higher for its 8th consecutive day, hitting a record high in the process. Going back through the 127-year history of the DJIA, this has only happened 42 previous times, or about once every 3 years (though they tend to cluster – we once went 26 years without such a signal from 1929 to 1955!):
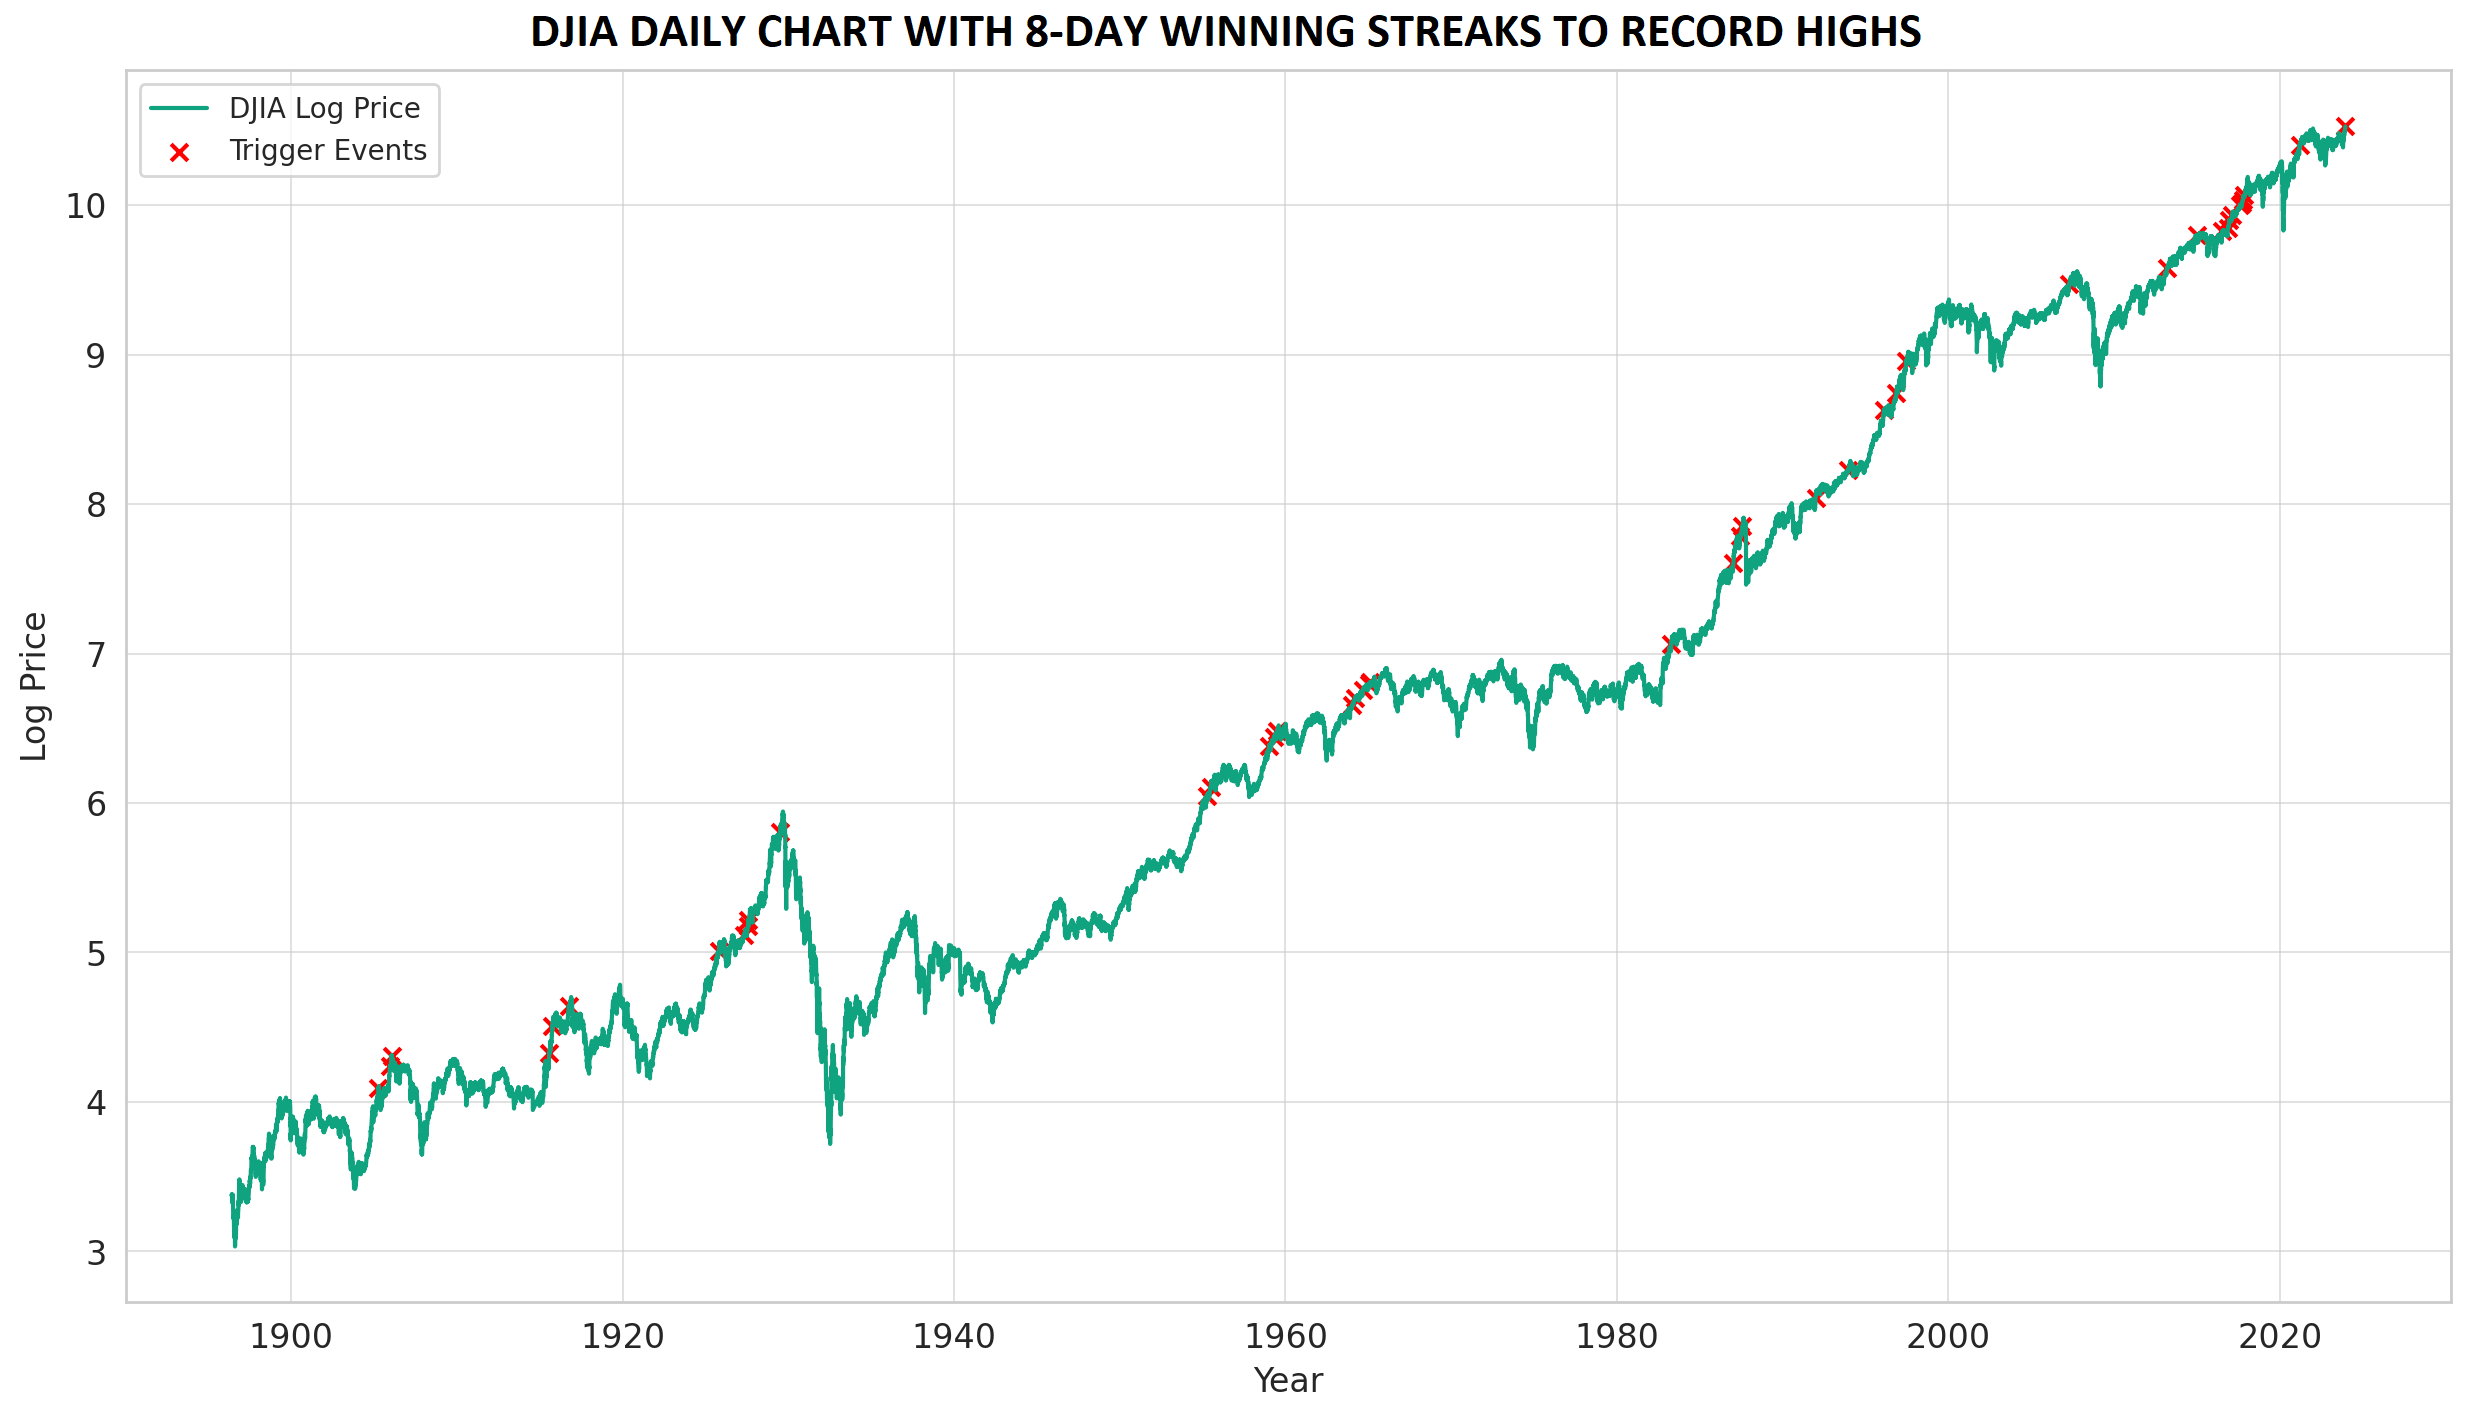
Source: TradingView, StoneX
While past performance is not necessarily indicative of future returns in financial markets, it can be helpful to look at how the Dow has historically performed following past 8-day winning streaks to record highs. On that front, forward returns have been generally strong, especially over a 1- and 3-month period. Following an 8-day winning streak to record highs, the DJIA has historically seen the following average returns:
- 1-month average returns = 1.9% (vs. 0.6% in all 1-month periods)
- 3- month average returns = 3.3% (vs. 1.9%)
- 1- year average returns = 7.5% (vs. 7.9%)
The table below shows the full track record of the signal to give a broad view of the potential range of outcomes from here:
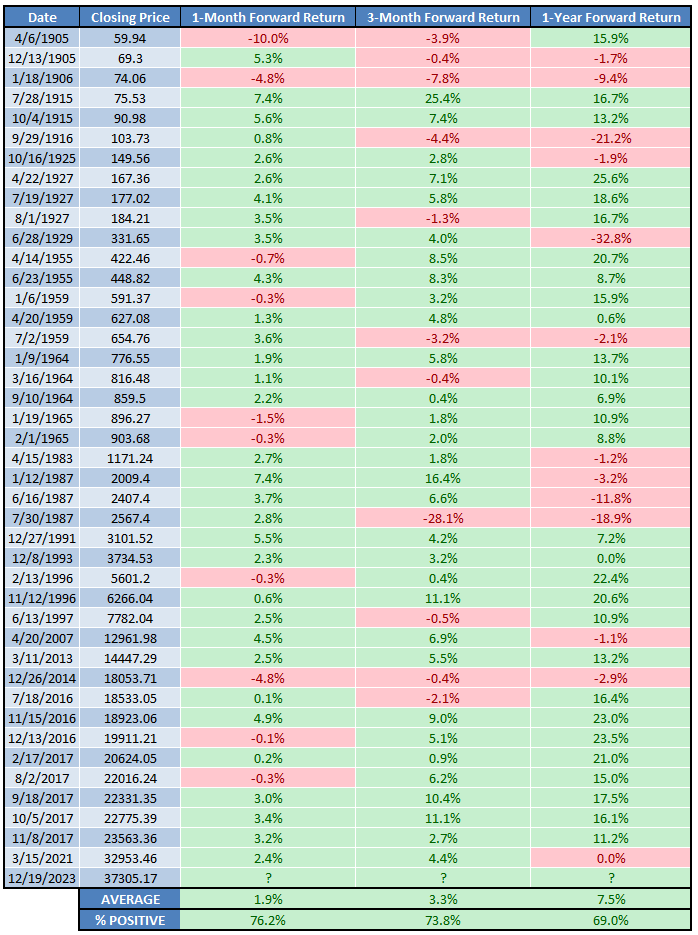
Source: TradingView, StoneX
Dow Jones Technical Analysis – DJIA Daily Chart
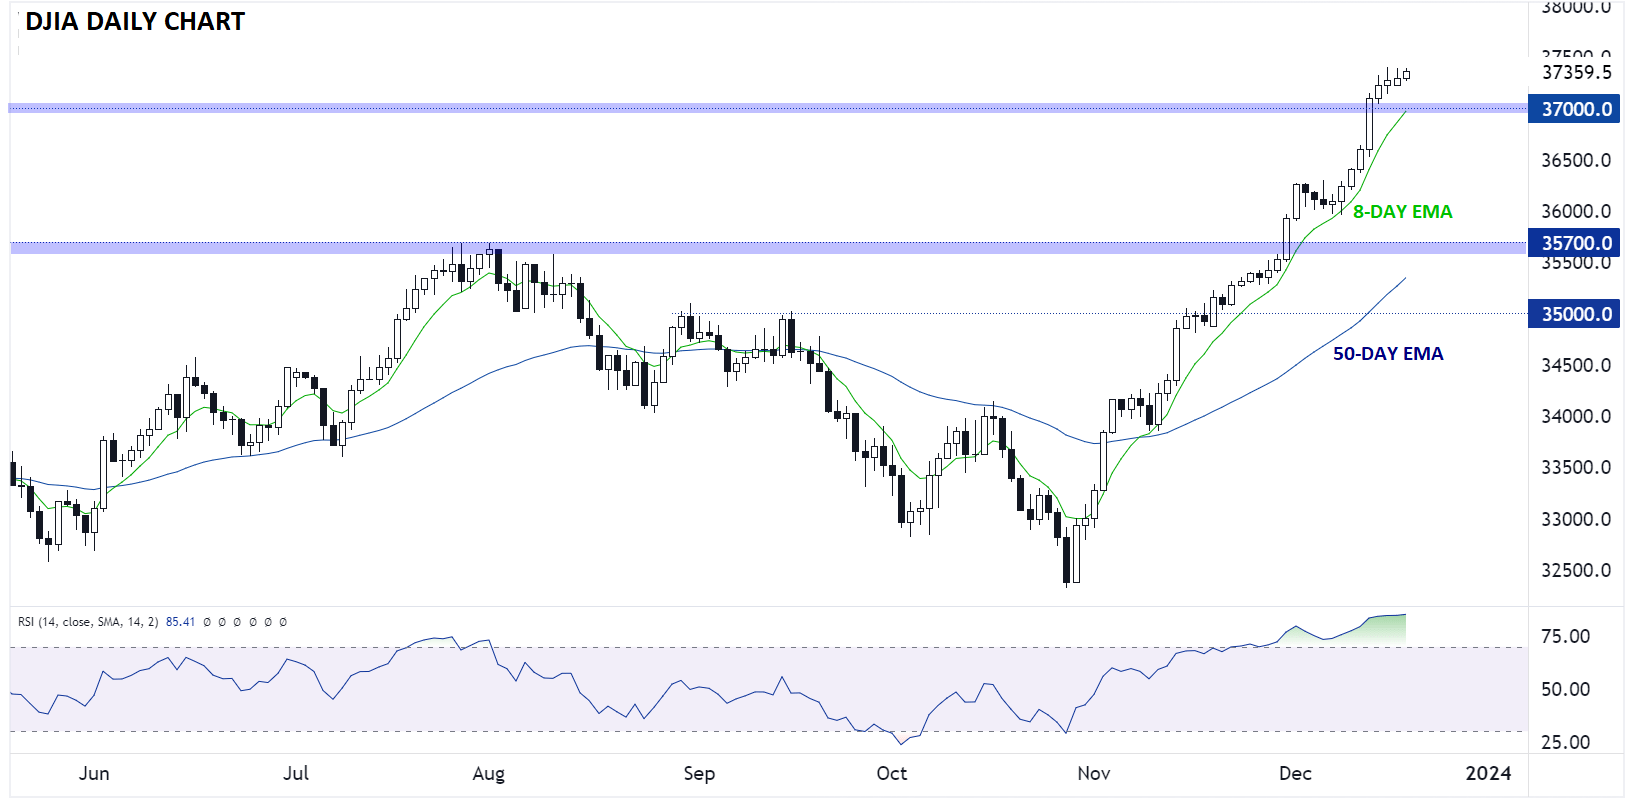
Source: TradingView, StoneX
Moving to more traditional analysis, the DJIA is, not surprisingly, showing signs of losing momentum as we head into the holiday period after its recent winning streak. With the 14-day RSI well in overbought territory, a short-term pause or pullback is a definitive possibility, and traders will be watching closely to see if the previous record highs near 37K will serve as support.
Even if the Dow breaks below 37K, the medium-term bullish trend is likely to find support just below the 36K area, where the rising 50-day EMA meets another area of previous-resistance-turned-support.
-- Written by Matt Weller, Global Head of Research
Follow Matt on Twitter: @MWellerFX
Latest market news
Yesterday 01:32 PM
Yesterday 09:35 AM
Yesterday 07:23 AM
Yesterday 04:48 AM
Yesterday 12:17 AM
July 25, 2024 10:39 PM
Latest DJIA articles

July 17, 2024 04:24 PM
July 11, 2024 04:30 PM
June 24, 2024 04:00 PM

June 18, 2024 01:57 PM