


Wall Street have fallen in line with risk appetite over the past 48 hours, on a combination of China woes and hawkish Federal Open Market Committee (FOMC) minutes. China's loan demand was revealed to be its weakest since 2009 over the weekend, and worse-than-expected retail sales, industrial production, and fixed-asset investment data rang the alarm bell for investors across Asia, Europe, and then the US. The PBOC's second interest rate cut in three months was seen as a sign of panic from Beijing.
Investors also had to contend with the FOMC minutes, which showed that Fed officials were divided over the need for more interest rate hikes. Some argued that the Fed should continue to raise rates to combat inflation, while others believed that the Fed should pause its rate hikes. The sell-off was also due to strong economic data that suggested that the Fed may need to keep rates high for longer than previously thought. Overall, the sell-off on Wednesday was a sign that investors are becoming more cautious about the outlook for the economy and the stock market.
The question now is whether the recent losses are part of a healthy retracement or something more serious.
S&P 500 technical analysis (weekly chart):
Given that the market is up over 30% since the October low and over 20% since March, it is unlikely that the S&P 500 could post similar returns in the second half of the year. While the weekly trend structure from the October low appears to be impulsive, the rally's inability to test the March high, let alone the all-time high, is a cause for concern for the bull camp. There may also be plenty of bears waiting on the sidelines, seeking to rejoin if prices continue lower.

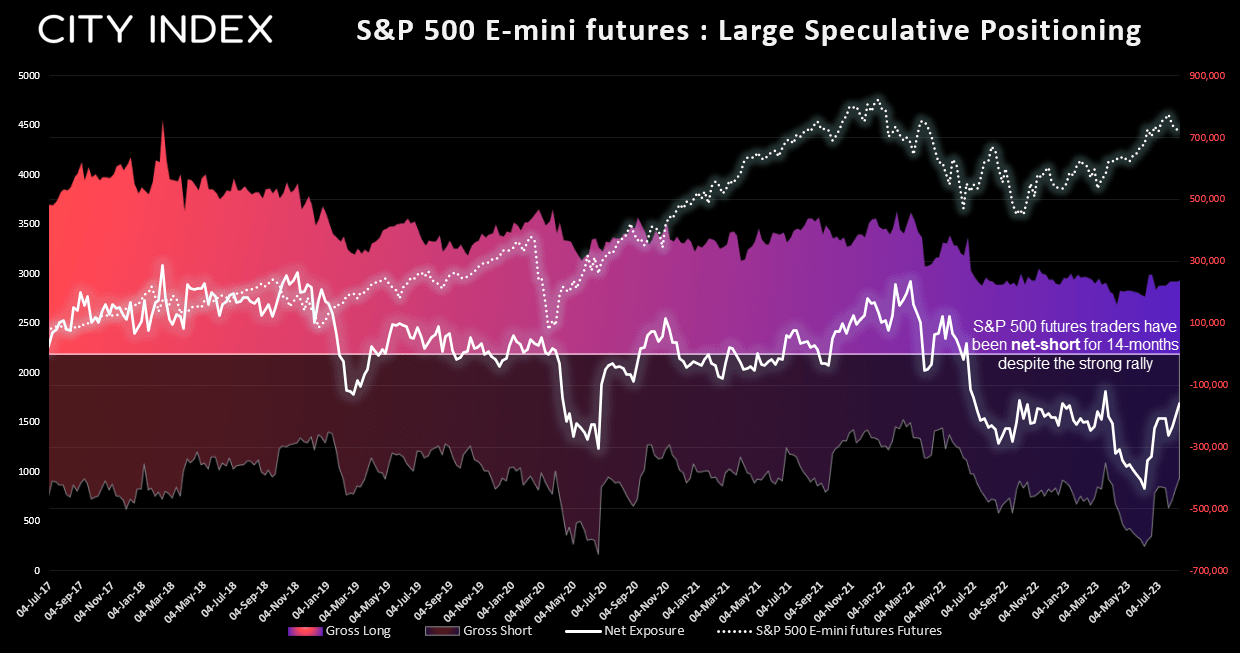
Large speculators reached a record level of net short exposure to S&P 500 futures in early June. This meant that prices either had to crash to justify their positioning, or they would be forced to cover their shorts and further fuel the rally. The latter happened, and the market ripped higher by another 9.4%. However, traders are still net short, even though they have trimmed their exposure by around two thirds. This means there are still plenty of bears who may want to join the trend if prices continue to move lower.
S&P 500 technical analysis (daily chart):
The daily chart shows that prices closed below trend support and closed at the low of the day. If sentiment remains fragile today, bears could seek shorts with a stop loss above Wednesday's high and target 450, or the support zone just above 4300.
However, as we know markets rarely move in straight lines, bears could also consider waiting to see if prices recycle higher towards the 4490 to 5000 resistance zone and waiting for evidence of a swing high before seeking shorts. While this risks missing the move, it could also increase the potential reward-to-risk ratio if it does, assuming the same target around 4350 or 4300.

-- Written by Matt Simpson
Follow Matt on Twitter @cLeverEdge
How to trade with City Index
You can trade with City Index by following these four easy steps:
-
Open an account, or log in if you’re already a customer
• Open an account in the UK
• Open an account in Australia
• Open an account in Singapore
- Search for the market you want to trade in our award-winning platform
- Choose your position and size, and your stop and limit levels
- Place the trade
Latest market news
Today 11:05 AM
Today 10:46 AM
Today 05:56 AM
Latest Trade Ideas articles

Today 11:05 AM


Today 05:56 AM

Yesterday 11:57 PM