


GBP/USD Key Points
- The British pound is relatively strong to start BOE week.
- With no change to interest rates expected, traders will key in on the BOE’s vote split and economic forecasts.
- GBP/USD is consolidating in a symmetrical triangle pattern, and a bearish breakdown could extend the H2 selloff below 1.2000.
GBP/USD Fundamental Analysis
Sometimes when it comes to economic data and trading activity, no news is the best news there is.
That’s the case today for the British pound, which sits near the top of the relative FX performance charts among the major currencies, despite a lack of meaningful economic data through the first few days of the week. Compared to the Japanese yen, which saw a disappointingly dovish BOJ meeting overnight or the euro, which is falling on the back of a miss in CPI, sterling looks relatively more attractive than it did yesterday.
Of course, this week’s key test for the pound will be Thursday’s Bank of England meeting. Governor Bailey and company aren’t expected to make any immediate changes to interest rates or monetary policy more generally, but after a 4-5 split vote in favor of leaving interest rates unchanged last month, the official voting results from the MPC should give insight into where the central bank is leaning.
In addition to the official monetary policy statement, the BOE will also update its quarterly economic forecasts. Governor Bailey reiterated earlier this month that the outlook was “very subdued” after the central bank last forecast GDP growth of just 0.5% in 2023 and 2024. That said, he did note that the latest moderation in inflation figures was “quite encouraging,” so traders will be keen to see if he hints at the potential for one last interest rate hike in this tightening cycle.
British Pound Technical Analysis – GBP/USD Daily Chart
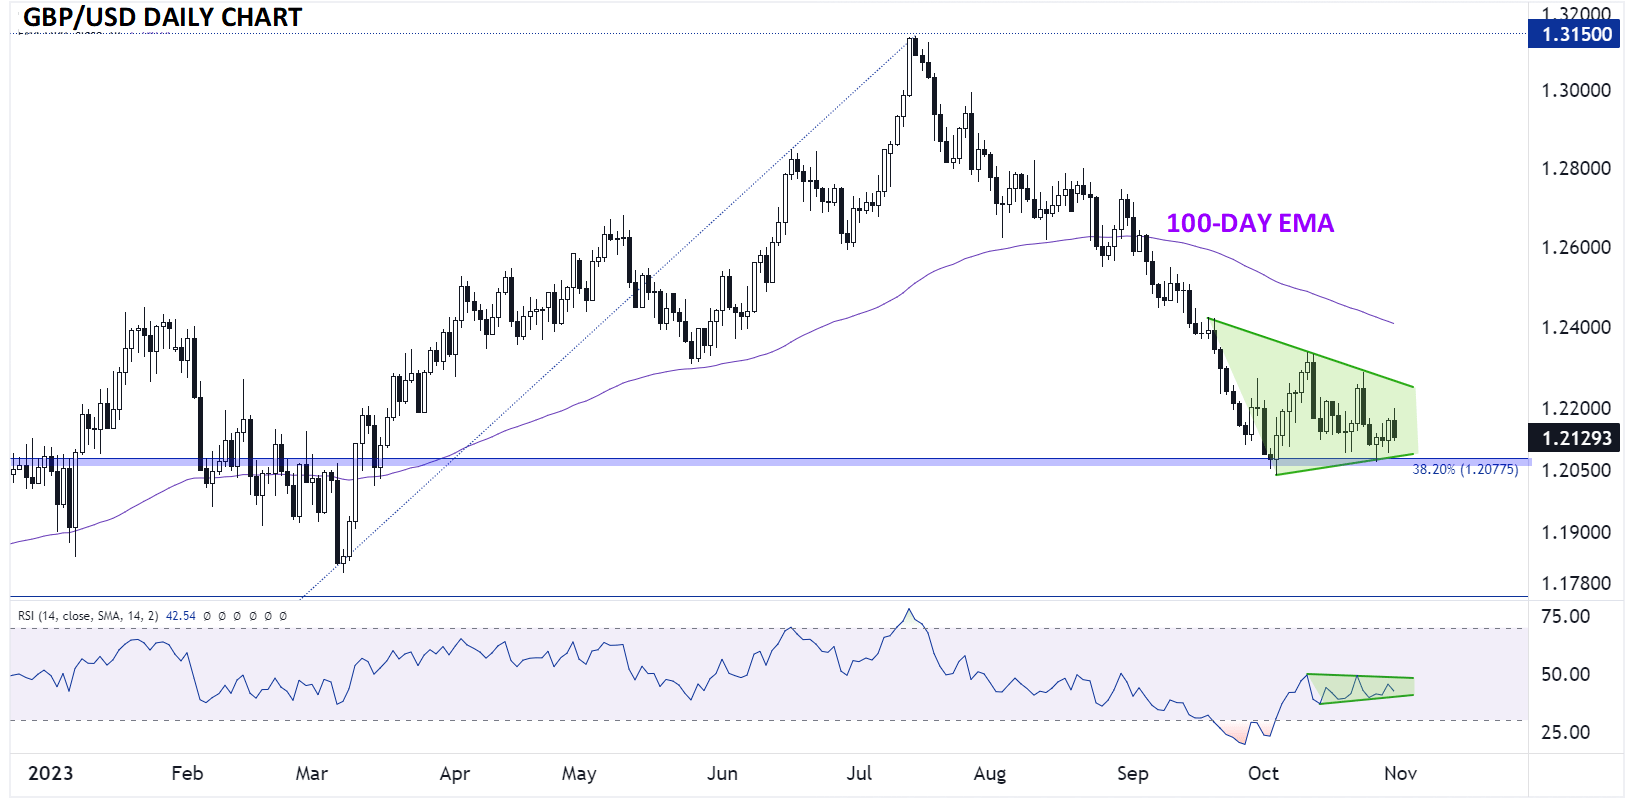
Source: TradingView, StoneX
As the chart above shows, GBP/USD has spent the last month+ consolidating in a symmetrical triangle pattern. The series of higher lows and lower highs indicates indecision in the market and is often seen followed by a higher-volatility continuation once rates eventually break out of the range.
Given the bearish momentum heading into the pattern, a bearish breakdown below 1.2075 is the more likely outcome from a technical perspective. If seen, GBP/USD could extend its H2 selloff to below 1.20 before encountering previous support in the 1.1900 zone. Meanwhile, a bullish breakout above 1.2275 would open the door for a more substantial bounce toward the 100-day EMA in the 1.2400 range.
-- Written by Matt Weller, Global Head of Research
Follow Matt on Twitter: @MWellerFX
Latest market news
Today 12:16 PM
Today 08:17 AM
Latest GBP USD articles

Yesterday 07:57 AM

April 29, 2024 03:13 PM

April 23, 2024 04:19 AM

April 22, 2024 04:33 PM