


Market Summary:
- Nvidia fever sent stock market indices to record highs on Thursday after it reported another strong set of earnings
- Nvidia’s stock gapped over 11% higher, finished the day up over 15% and added $250 billion to its market cap
- The global stock market rally began in Asia after the after-hours Nvidia report, with the Nikkei 225 breaking above its previous record high set in 1989, DAX hitting an all-time high ahead of the European open and the S&P 500, Nasdaq 100 and Dow Jones quickly following their lead
- AUD/JPY broke to a 7-year high during the risk-on session, although prices pulled back to the key level heading into the NY close
- US initial jobless claims was lower than estimated at 201k (2017k consensus) to underscore a strong economy and further reduce bets of Fed cuts
- The US dollar index reversed earlier losses and recovered back above its 200-day EMA, closing the day flat with an elongated bullish pinbar
- Similar reversal patterns were seen on EUR/USD, GBP/USD, AUD/USD, USD/CAD and USD/CHF
- The New Zealand dollar was again the strongest FX major and rose for a seventh day, presumably on short-covering ahead of next week’s RBNZ meeting
Events in focus (AEDT):
- 08:45 – New Zealand retail sales
- 09:00 – Fed Governor Cook Speaks, FOMC Member Kashkari Speaks
- 11:01 – UK consumer confidence (GfK)
- 11:35 – Fed Waller Speaks
- 12:30 – China house prices
- 16:00 – Singapore CPI
- 18:00 – German GDP
- 19:30 – SNB Vice Chairman Schlegel Speaks
- 20:00 – German business sentiment (Ifo)
- 20:20 – ECB’s Schnabel Speaks
- 20:30 - ECB's Supervisory Board Member Jochnick Speaks

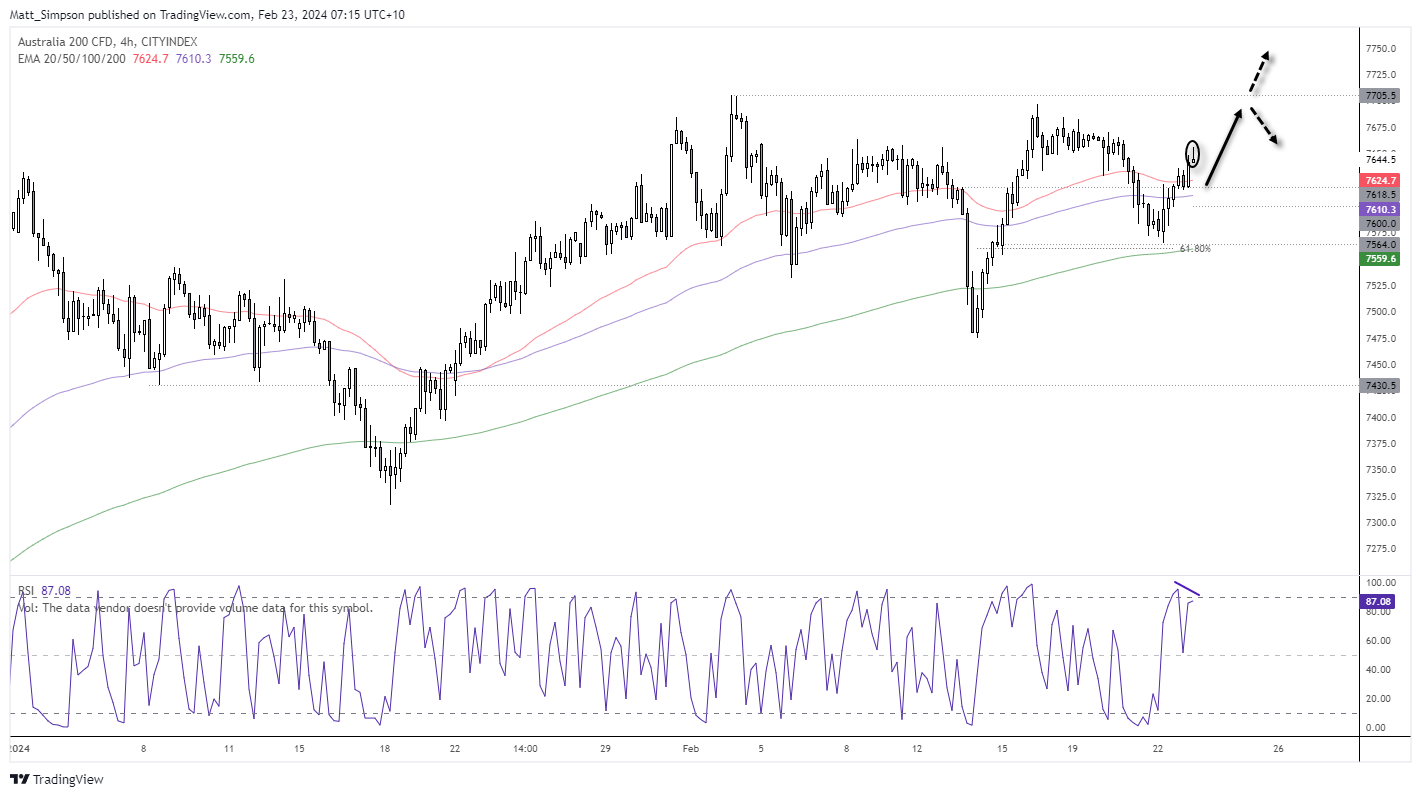
ASX 200 at a glance:
The risk-on rally across on Thursday helped the ASX 200 extend its gains overnight. The 4-hour chart shows a strong rally from the 200-day EMA and 61.8% Fibonacci level, although a small shooting star candle formed alongside an RSI divergence (after it has reached overbought). This is nothing major and could simply mean a small retracement or period of consolidation.
Ultimately any dips towards the 50-bar EMA or 7624.7 support level could be favourable for bears, but if prices simply extend their lead at the open then a move for 7700 could be on the cards. At which point we’ll find out whether it has the momentum to break to a new record high or retreat once more from that pivotal level.
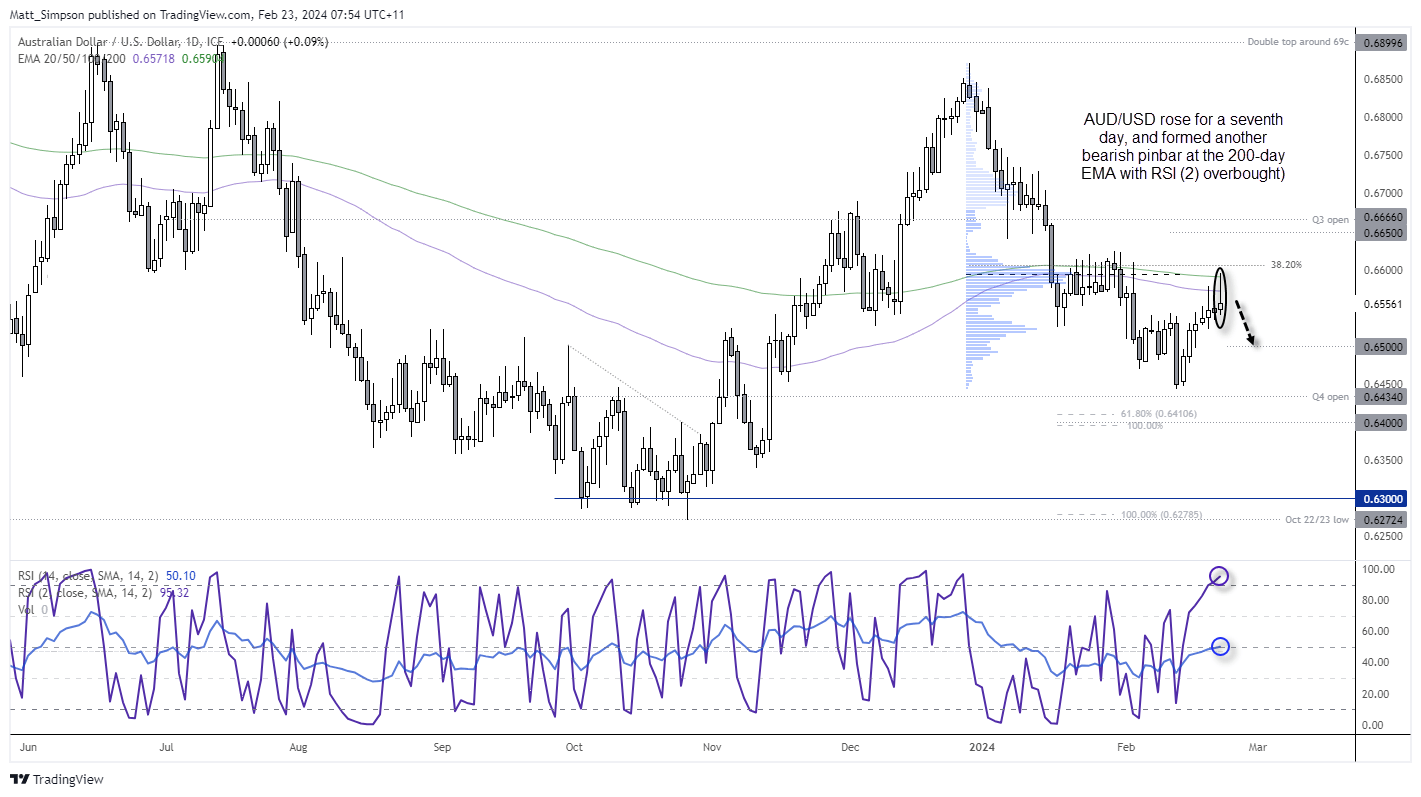
AUD/USD technical analysis:
The weaker US dollar has allowed AUD/USD to rise for a seventh day, although a series of upper wicks over the past three days suggests bears are losing steam. A bearish pinbar also formed on Thursday after a false break of the 100 and 200-day EMAs. RSI (2) is overbought, and RSI (15) is around the neutral level of 50 – so if prices turn lower from here, it will revert to bearish mode below 50.
Bears could seek to fade into retracements within Thursday’s range with a stop above its high, or the 38.2% Fibonacci level. 0.6500 make a viable initial target, a break beneath which brings the lows around 0.6450 into focus.
View the full economic calendar
-- Written by Matt Simpson
Follow Matt on Twitter @cLeverEdge
How to trade with City Index
You can trade with City Index by following these four easy steps:
-
Open an account, or log in if you’re already a customer
• Open an account in the UK
• Open an account in Australia
• Open an account in Singapore
- Search for the market you want to trade in our award-winning platform
- Choose your position and size, and your stop and limit levels
- Place the trade
Latest market news
Yesterday 01:32 PM
Yesterday 09:35 AM
Yesterday 07:23 AM
Yesterday 04:48 AM
Yesterday 12:17 AM
July 25, 2024 10:39 PM
Latest Asian Open articles

July 25, 2024 10:39 PM

July 24, 2024 10:10 PM

July 23, 2024 11:29 PM

July 22, 2024 10:43 PM