


Revenue is a key figure on a company’s earnings statement, used by analysts, investors and traders to make decisions about whether to buy or sell stock. Find out what revenue is, how to calculate it and what it means in stock analysis.
What is revenue?
Revenue is the amount of capital generated from a company’s normal business operations. It’s also called the top line, or gross income. The figure is used as the basis for calculating other metrics, such as net income.
While revenue is normally attributed to company sales, it can also describe other types of income such as money earned from investments, or interest on bonds. However, not all companies report their revenue in the same way – a lot of companies only report ‘net sales’ to represent sales revenue after any returns made.
Where’s revenue found on an earnings statement?
Revenue is found at the top of an earnings or income statement, which is why it’s called the ‘top line’. In contrast, net income is known as the bottom line, because it’s at the end of the earnings statement.
Learn how to read an earnings report.
It’s revenue, income and earnings-per-share that receive the most attention from analysts and investors once a company reports its earnings. If a company misses or beats expectations for any of these figures, it can move the share price.
Revenue vs income
Revenue only describes the proceeds from a company’s sales, whereas income or profit deducts expenses from any earnings (such as revenue) to report the net capital made by the company. The two are related, as to increase net income and profits, a company has to increase its revenue or cut costs.
Revenue is found on a company’s income sheet, part of an earnings report for a given accounting period. It’s one of four crucial figures listed, the others being gains, expenses and losses.
The final figure reported on the sheet is net income, which is the sum of the entire statement once expenses and losses have been deducted from revenue and gains.
Revenue vs cash flow
While revenue is the money a company earns through sales, cash flow is the net amount of cash moving in and out of a company. Revenue indicates how effective a company is at selling goods and services, and cash flow indicates how liquid a company is at any given time.
A positive cash flow indicates that the company’s assets and revenues are increasing sufficiently that it’s able to repay debts, reinvest capital and even pay dividends. A negative cash flow would indicate it has insufficient capital to meet such obligations.
Cash flow statements are reported alongside balance sheets and income statements in company earnings. It will start with the net income – which is carried over from the income statement, where revenue is listed – and then go through any subtractions from the cash flow.
Learn about financial ratio analysis
Types of revenue
Revenue is broadly divided into two categories: operating and non-operating.
Operating revenue is the money generated from a company’s main business activities. For example, an oil refinery’s primary business is turning crude oil into petroleum, and so its operating revenue would be generated from selling that petroleum product. A tech company’s operating revenue would be generated from the sale of its goods or services to others.
Operating revenue is not to be confused with operating income, which is the amount of profit the company generates from business operations after all expenses have been deducted.
Non-operating revenue is generated by any activities outside of these normal business operations. They’re not as regular as operating revenue, so are unpredictable additions. This could be from things like events, the sale of property, or any lawsuit proceeds.
Unlike operating revenue and operating income being separate terms, non-operating revenue is widely used synonymously with non-operating income.
It’s important to note that only operating revenue is included in cash flow because non-operating revenues are not consistent. That’s why it’s listed separately on a balance sheet, usually after income from operations.
How to calculate revenue
Revenue is calculated by looking at the total number of products sold, or the number of services provided, and multiplying it by the average price. But that’s a very general method. In reality, calculations can vary between companies, industries and geographies – and between the accrued or deferred methods of accounting.
Accrued revenue is the money generated on goods and services that have been delivered but not necessarily paid for by the customer. Although this gives a snapshot of the company’s sales, it doesn’t necessarily translate into income, because goods and services could be refunded.
Deferred revenue is more common, as the method involves a company receiving payment in advance from the customer for the goods or services, and delivery takes place later. Until the goods are received, the capital is reported as a liability on the balance sheet – this is so the company doesn’t spend money it doesn’t have, in case the customer is unsatisfied and makes a return.
Let’s look at a basic revenue calculation using the deferred method, as this is the most common.
Formula for revenue
The formula for revenue is:
Revenue = (quantity sold * unit price) - discounts - allowances – returns
Usually, this formula is used for each revenue stream independently and then added together to create the company’s total revenue. This is to account for the different prices of goods and services that a single company might provide.
The discounts, allowances and returns are subtracted from the total revenue in a deferred method of accounting to accurately reflect how much was collected in total. In an accrual method of accounting, returns wouldn’t be subtracted from the balance until later.
Revenue income examples
Let’s look at a few examples of balance sheets to better understand how revenue can be reported.
Amazon revenue
Amazon’s revenue for Q2 2022 was $121.234 billion. We see this indicated in red on the balance sheet below. Amazon’s revenue is reported as total net sales – as a lot of ecommerce and retail companies do – which is divided into net product sales and net service sales to account for the company’s two revenue streams.
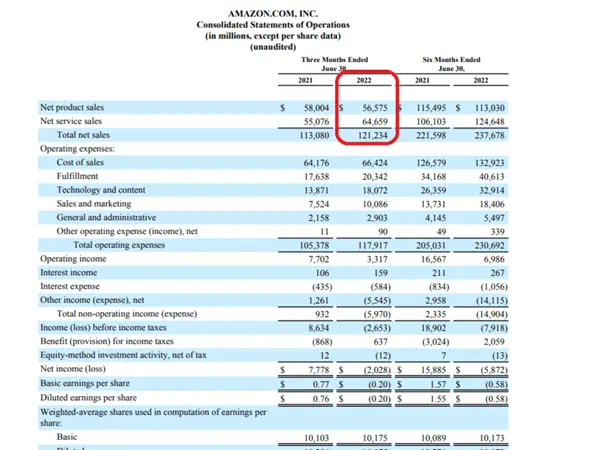
Source: https://ir.aboutamazon.com/quarterly-results/default.aspx
Google revenue
Google’s revenue for Q2 2022 was $69.685 billion, listed on the income statement as ‘revenues’. It’s not broken down into segments in the income statement, but in the complete earnings report revenue streams are separated out.
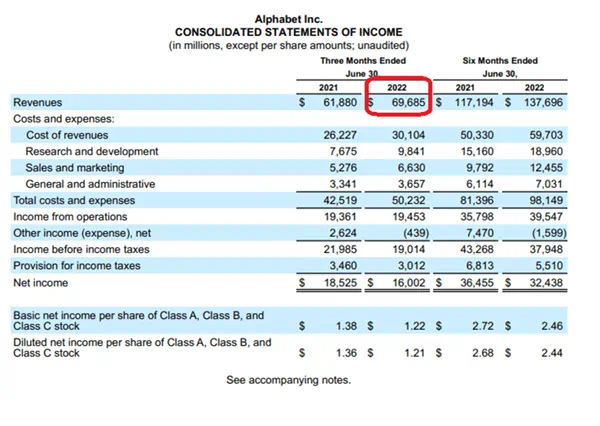
Source: https://abc.xyz/investor/
How is revenue used in stock analysis?
Investors and traders regularly use revenue in stock analysis. Specifically, they look at a company’s forecasted revenue to assess long-term growth and value.
Forecasted revenue figures are released by analysts across the industry that have collected data from the company, wider industry and consumers, in order to assess modelled revenue. These numbers are released in the lead up to a company’s earnings report, to give investors an idea of what to expect and what the appropriate value for the stock is.
If the actual figure reported on the day of the earnings is different, that’s where we see movement in share prices. When the markets are ‘surprised’ by revenue – which is what happens when it comes in above or below estimates – investors will rush into or out of positions to account for the changing value of the stock.
A positive surprise often leads to an increase in the company’s shares, while a negative surprise can cause a decline. It’s important to note that this isn’t a hard and fast rule – especially not when only considering revenue, as there are a lot of other figures to watch out for in an earnings report.
How to trade company earnings with City Index
Whether you think a company’s share price will rise or fall, you can take your position on thousands of stocks in and around earnings season with City Index.
- Open a City Index account, or log in if you’re already a customer
- Search for the company you want to trade in our award-winning platform
- Choose your position and size, and your stop and limit levels
- Place the trade
Or you can try share trading risk free by signing up for our demo trading account.
Latest market news
Yesterday 01:32 PM
Yesterday 09:35 AM
Yesterday 07:23 AM
Yesterday 04:48 AM
Yesterday 12:17 AM
July 25, 2024 10:39 PM
Latest Stocks articles

July 18, 2024 11:35 AM

June 13, 2024 02:00 PM

June 6, 2024 02:00 PM
June 2, 2024 08:00 AM