


What is an earnings report?
An earnings report is a document that all publicly-traded companies are legally required to produce every quarter. The report outlines the financials of a company, so it’s an opportunity for the business to share its current outlook with investors and the general public.
Earnings reports are released around the same time, in what is known as earnings season. During peak earnings season, over 100 companies can report every single day. Earnings season is a couple of weeks after the close of a quarter. Usually, this is:
- April, for the quarter ending in March
- July, for the quarter ending in June
- October, for the quarter ending in September
- January, for the quarter ending in December
It’s worth noting that while most companies divide the year up into these quarters, not all do.
Learn more about earnings season.
Where can you find earnings reports?
Earnings report filings will go straight to the exchange regulators, such as the US Securities Exchange Commission (SEC), who publish company earnings to investors. But you can also usually find earnings reports on each company’s investor information hub.
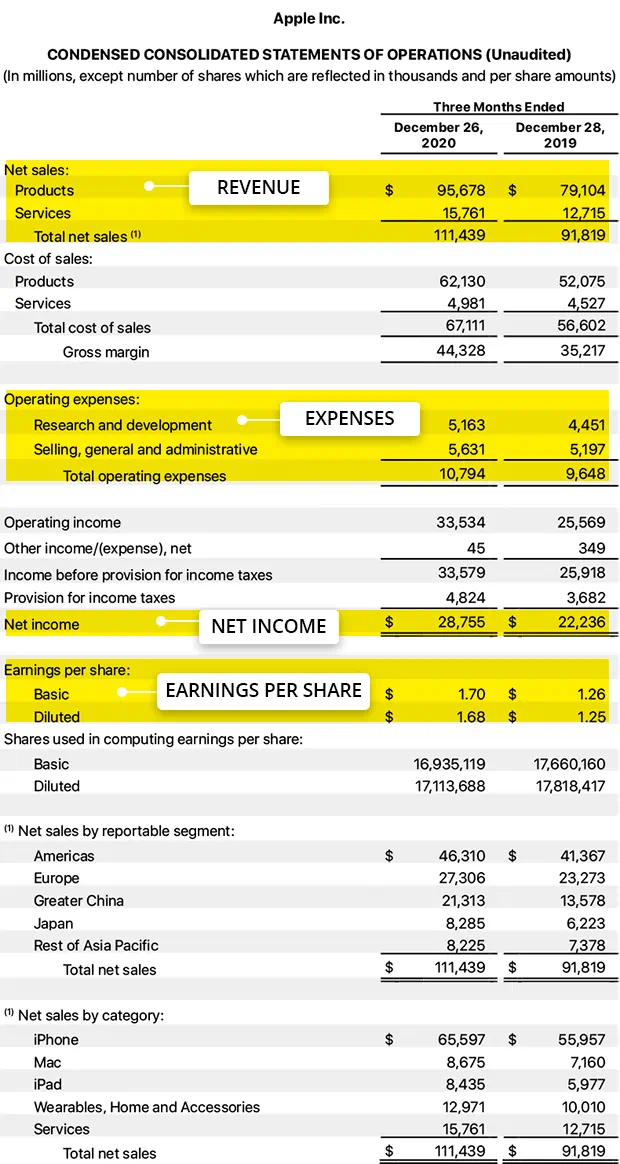
What to look at in an earnings report
Earnings reports can be hundreds of pages long, but for the most part, there are only a few metrics that investors will look at to make their judgements. These include:
- Revenue or sales
- Expenses
- Net income
- Earnings per share
Mostly, traders and investors will focus on these financials, but it’s always important to be aware of the other factors that have influenced its performance. The other information that will be covered in an earnings report will look at any ongoing legal issues and potential risks to the company. It also includes the management’s view of the financial quarter and its future outlook.
Company revenues
A company’s revenue – also known as sales or top line – is the amount of money it’s made through sales during the quarter. Revenue isn’t necessarily an indicator of the firm’s overall success, but it can paint a picture of how consumers interact with the company.
When looking at revenues, you should be assessing whether the company’s sales have increased or decreased from the same quarter the previous year, and the previous quarter that year.
The differences between quarters can help you ascertain whether sales have increased or decreased, whether the cost of sales (logistics, marketing, rent, people, etc) is cheaper or more expensive, or whether market risks have impacted sales.
Mostly, investors will focus on revenues first to understand the company’s health – particularly if the company, sector, or economy is in a period of decline. As if sales are continuing, but other market risks are impacting the rest of a company’s financials, it can be a sign they’ll bounce back.
Operating expenses
A company’s expenses are the money they’ve spent during the quarter on operations. This includes costs that are involved in the complete end-to-end of the product or service, such as research and development (R&D), marketing, and general head costs of running the business.
While expenses will detract from a final profit, some outgoings are viewed as a positive by markets. For example, larger investments into R&D can indicate an upcoming new technology, and a large hiring push in new geographic locations can be a sign of future expansion.
Net profits
A company’s profits – also known as its bottom line or net income – is the amount of money the firm has left after it’s subtracted all of its expenses from its revenue. This is the most important metric as it’s the money a company makes and will have for future operations or to distribute to shareholders.
A company that reports profits every quarter will usually see demand for its stock, particularly if this translates into dividends. However, a net loss isn’t always a turn-off for investors either. Some companies can take years to turn a profit but will appeal to investors based on the earnings potential.
Often when the expenses are more than the revenues, the company has made up the difference through loans. A huge pile of debt can lead investors to be more cautious about buying the company’s stock.
Earnings per share
The earnings per share (EPS) metric is a measure of how much profit a company has generated allocated to each outstanding share of its common stock. This is probably the most talked-about metric, one you’ll see all over post-earnings press and analysis.
It’s calculated by subtracting the difference between a company’s net income and dividends, divided by the number of shares a company has on the market.
If a company has a high earnings per share, it’s usually an indication that it has money available to reinvest or distribute to shareholders.
Tips for reading earnings reports
1. Read third-party analysis and estimates
Both before and after an earnings report, you should take a look at third-party analysis from financial professionals.
In the run-up to an announcement, analysts will start releasing their earnings estimates – particularly for EPS. While these can indicate what to expect, they’re more important after the report is public.
Interpreting earnings reports aren’t an exact science, as a lot of the subsequent share price movements depend on how the market perceives the financials, rather than the financials themselves.
You’ll often hear talk about a company’s earnings ‘beating estimates’ or ‘missing estimates’, and this disparity between predictions and actual figures can have a big impact on share prices.
If the estimates are close to or spot-on for the actual financials, markets will likely not move that much after the event, as there is no new information to factor into the share price. However, if the real figures are above or below estimations, there’s often volatility as investors and traders rush in to adjust their positions.
Get the latest news and analysis from our in-house experts.
2. Compare financial trends and company guidance
One of the most important things to notice when you’re reading an earnings report is the trends each number is showing you. Is the company’s revenue increasing or decreasing? Is the bottom-line rising each year?
When you combine any trends with the company guidance and analysis that the management team gives, you should be able to judge whether or not the company is confident in its future.
Company guidance is released alongside earnings reports, although it’s not a legal requirement. It gives investors an idea of what could happen in the next quarter and year ahead.
Company guidance does have a big impact on shares, as it’s the most forward-looking part of the report. If the guidance is lower than expected, it will cause the share price to drop, and higher guidance can boost the share price.
3. Read the press release
An earnings report can be well over a hundred pages, so a lot of share traders will look to find the headline facts they’re interested in. As the reports are so long, it can be easy for companies to gloss over certain details or hide data amongst a lot of wordy explanations.
One way of finding the highlights is by looking at the press release that accompanies the report and gives an overview of the essential numbers and bottom-line information. However, it’s important to note that these come from the companies themselves. So, in much the same way as the earnings report, they can have a positive spin.
A lot of traders will look straight to the tables of data, skipping over all the company’s interpretations of its performance. This way, the information is fairly black and white.
4. Take the CEO with a pinch of salt
A CEO is a salesperson. They’re there to make the company look good and boost investor confidence, even when there is something worth worrying about.
Listening to the earnings call and reading the comments from the CEO are vital to understanding what the company thinks about its future, but you should always compare this to the numbers to see if everything tallies up. You want the financials and company outlook to compliment each other. If there are troubling numbers, the CEO should acknowledge this and provide a solution to investors to ease concerns.
If a CEO or management’s statement is exceptionally positive, and the figures don’t align, it can be a red flag.
How to trade top stocks
You can speculate whether share prices will rise or fall during earnings season with City Index using spread bets or CFDs, with spreads from just 0.1%. Follow these easy steps to start trading:
- Open a City Index account, or log in if you’re already a customer
- Search for the company you want to trade in our award-winning platform
- Choose your position and size, and your stop and limit levels
- Place the trade
Latest market news
Yesterday 01:32 PM
Yesterday 09:35 AM
Yesterday 07:23 AM
Yesterday 04:48 AM
Yesterday 12:17 AM
July 25, 2024 10:39 PM
Latest Stocks articles

July 18, 2024 11:35 AM

June 13, 2024 02:00 PM

June 6, 2024 02:00 PM
June 2, 2024 08:00 AM