


Gold Key Points
- Gold is pulling back despite this morning’s hotter-than-expected US CPI report.
- The dollar’s strength and opportunity cost of the yellow metal are outweighing its inflation hedge credentials
- Both the long- and shorter-term technical pictures for gold remain constructive for a retest or break of $2075 resistance.
Gold Fundamental Analysis
Like most commodities, the pure “fundamentals” for gold – supply and demand – change at a glacial pace. While it’s certainly true that factors like central bank buying and mining techniques can influence the price of the precious metal over a multi-year horizon, on a day-to-day basis, sentiment toward the precious metal plays a far larger role.
Any finance textbook will tell you that gold is seen as a hedge against inflation, and from that view, today’s hotter-than-expected US CPI report should be a bullish development for gold, but there’s a world of difference between textbook analysis and real markets.
As Yogi Berra famously said, “In theory there is no difference between theory and practice. In practice there is.”
In the current macroeconomic backdrop, higher-than-expected inflation could push the Federal Reserve to leave interest rates at 20+ year highs for longer than markets had expected; this has the dual impact of boosting the US dollar, which is by far today’ strongest major currency, and making gold a comparatively less compelling investment than cash-flowing bonds and stocks. Trader sentiment has accordingly soured toward the precious metal as a result of these factors, leading to today’s drop to 1-month lows near $2015.

Gold Technical Analysis – XAU/USD Weekly Chart
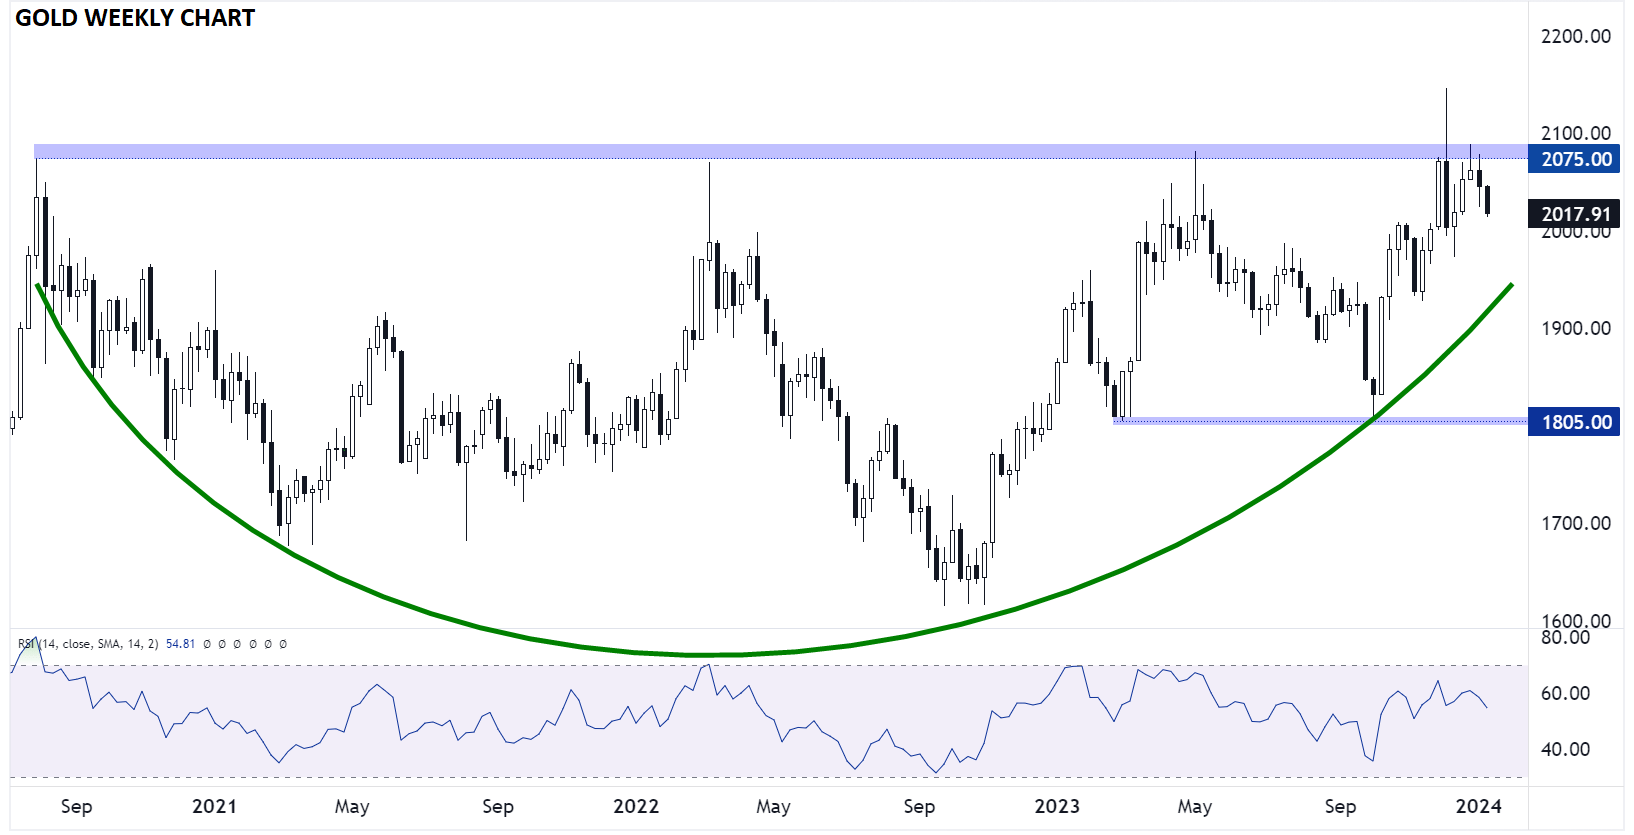
Source: TradingView, StoneX
While the near-term fundamental picture toward gold has led to a dollop of selling, the longer-term technical picture remains constructive. As the weekly chart above shows, Gold has formed a large rounded bottom over the last 3+ years, with clear resistance at the record highs in the $2075 area. Even a short-term pullback into the mid-$1900s would not invalidate this longer-term bullish setup.
Gold Technical Analysis – XAU/USD Daily Chart
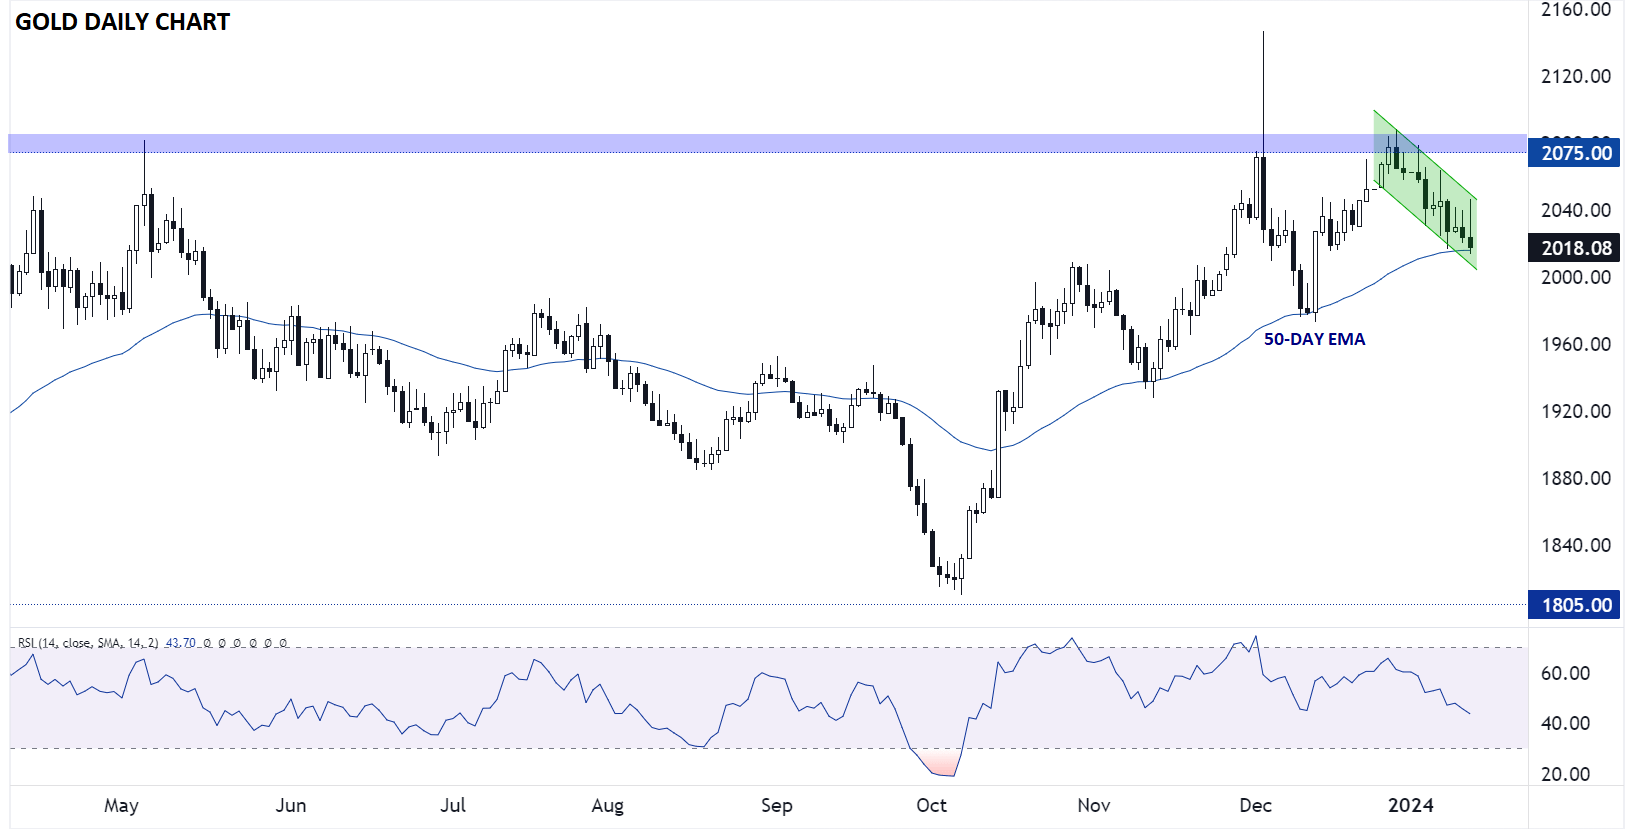
Source: TradingView, StoneX
Zooming in to the daily chart, it’s clear that Gold has consistently found support at its rising 50-day EMA over the last month. After a relatively shallow and controlled pullback so far this year, the precious metal is now testing that key support level, hinting at a possible bounce as we head into next week. A break above the near-term bearish channel would open the door for a(nother) retest of the key $2075 resistance area.
As long as gold continues to put in higher lows on both the daily and weekly charts, pressure will build on its $2075 resistance area, setting the stage for a potentially massive breakout later this year.
-- Written by Matt Weller, Global Head of Research
Follow Matt on Twitter: @MWellerFX
Latest market news
Yesterday 01:32 PM
Yesterday 09:35 AM
Yesterday 07:23 AM
Yesterday 04:48 AM
Yesterday 12:17 AM
July 25, 2024 10:39 PM
Latest Gold articles

Yesterday 09:35 AM

July 25, 2024 05:30 AM
July 23, 2024 05:20 PM
July 23, 2024 03:17 AM