


GBP/USD exchange rate history
When was the last time the British pound sterling traded at parity (1.00) with the US dollar?
No need to dig out your history books; it’s a trick question. The pound has NEVER traded at parity with the US dollar.
After spending the entirety of the 1800s at around 5:1, sterling has been trending generally lower against the greenback for the past century. The closest the two currencies got to one another was in 1985, when the GBP/USD exchange rate briefly fell below 1.10:
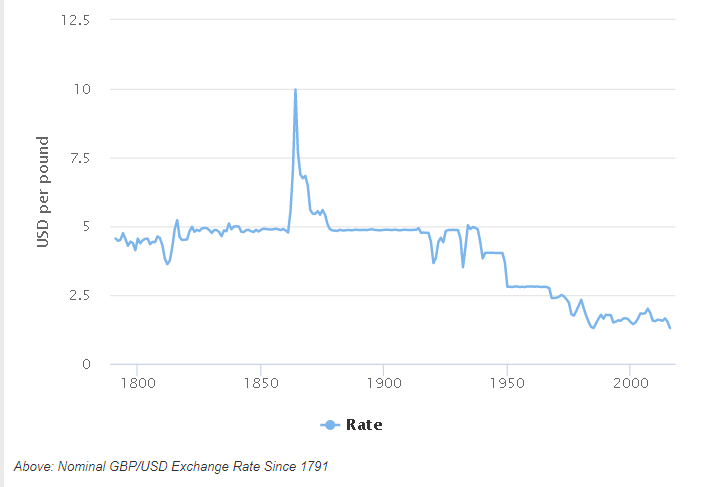
Source: exchangerates.org.uk
GBP/USD: Historical parallels with 1985
Proving that history doesn’t repeat but it does rhyme, the new UK Prime Minister Liz Truss’s role model, Margaret Thatcher, was in charge back then, and the US had passed large tax cuts under a Republican President (Reagan) a few years earlier that were starting to bear fruit on the underlying economy. Eerily, both the US and UK were grappling with elevated inflation in 1985, though the US was able to get a grasp on price pressures before its colonial overseer, much as traders and policymakers are expecting this time around. In addition, oil prices were normalizing after a sharp spike into the triple digits that led to rationing and calls for price caps.
What factors could drive the pound to parity?
Relative to the US economy, the UK economy is at higher risk of seeing a brutal stagflationary period in the coming quarters. The BOE recently predicted that the UK economy would see a prolonged recession and that inflation would peak above 13%; notably, that inflation forecast was before the UK government announced a plan to cap household energy prices that may put peak inflation closer to 11% in the island nation, but that is nonetheless higher than the US is expected to reach.
While it may defray price pressures, the UK government’s energy cap scheme risks blowing out the UK’s current account deficit further. As a reminder, the current account measures the total value of goods and services a country imports relative to the total value of goods and services it exports. After holding steady in the 1% to 5% of GDP range for decades, the UK current account recently widened to 8% in Q1 2022. If gas prices keep rising due to Russia cutting off deliveries to the European continent, the cost of the energy subsidy scheme could soar, exposing the government’s balance sheet to large losses and driving down the value of the pound sterling sharply.
What to watch on the path to pound parity
Once seen as fanciful, there is some evidence that FX options traders are at least considering the possibility of GBP/USD parity. According to NatWest, current options pricing implies a roughly 25% chance that GBP/USD could hit 1.00 in the next 12 months; similar calculations by Bloomberg put the implied probability closer to 20%.
As outlined above, a continued rise in energy prices could speed the prospect along, as would stubbornly high inflation or a deep recession on the European continent. Technically speaking, GBP/USD is currently testing its COVID-lows near 1.1400, the last level of previous support until the 1985 closer to 1.0500. While still not necessarily the most likely path, a break below the 1985 lows would truly bring parity into play for the first time in the 200+ year history of the GBP/USD exchange rate.
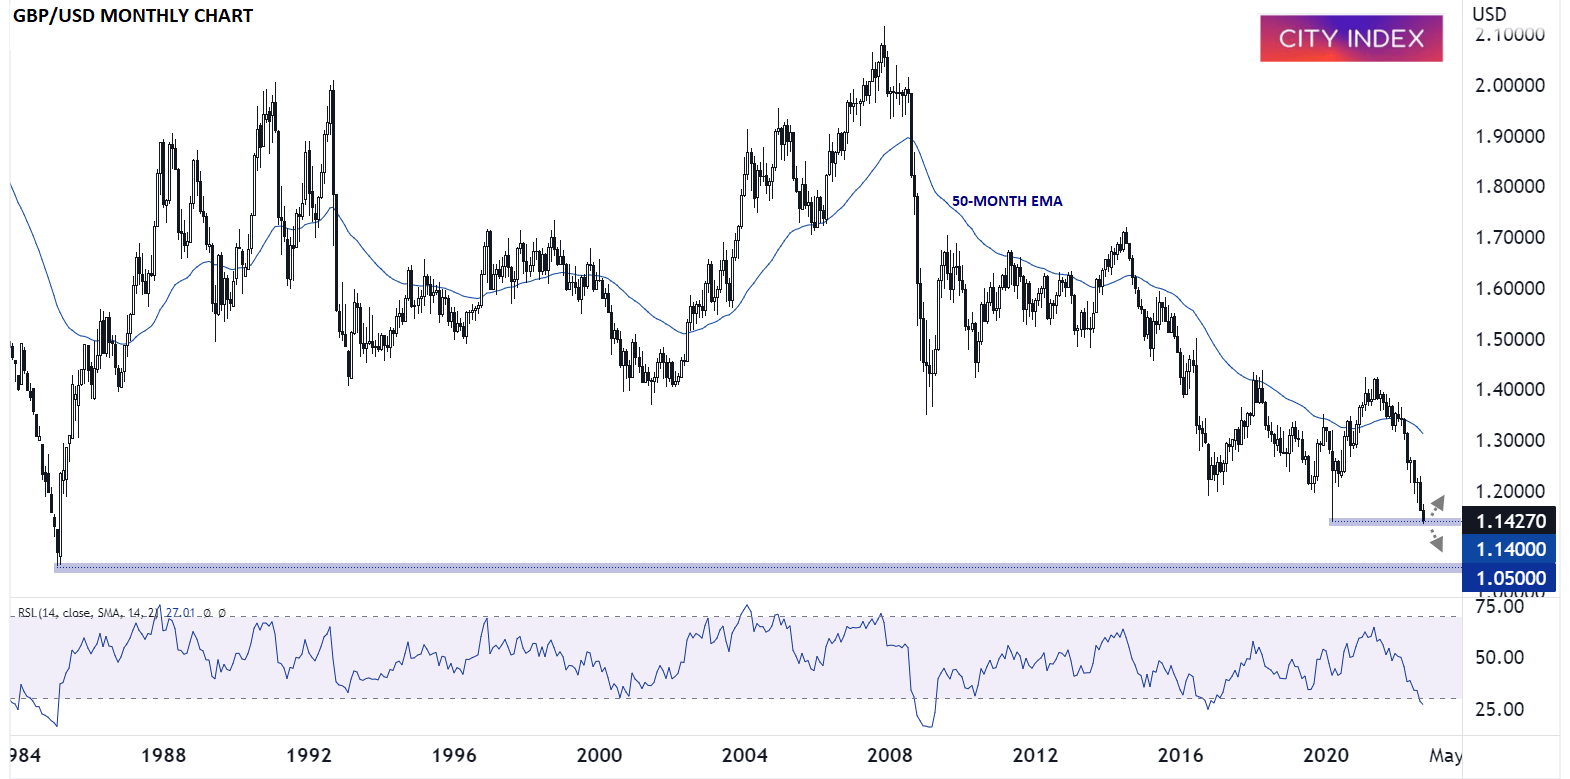
Source: TradingView, StoneX
How to trade with City Index
You can trade with City Index by following these four easy steps:
-
Open an account, or log in if you’re already a customer
• Open an account in the UK
• Open an account in Australia
• Open an account in Singapore
- Search for the market you want to trade in our award-winning platform
- Choose your position and size, and your stop and limit levels
- Place the trade
Latest market news
Yesterday 01:32 PM
Yesterday 09:35 AM
Yesterday 07:23 AM
Yesterday 04:48 AM
Yesterday 12:17 AM
July 25, 2024 10:39 PM
Latest GBP articles
June 8, 2024 08:00 PM

May 25, 2024 08:00 PM
May 7, 2024 12:26 PM
May 4, 2024 08:00 PM