


“The opposite of love is not hate; it is indifference” – Elie Wiesel
What a difference a year makes!
At this time last year, it seemed like you couldn’t go five minutes without a newly converted crypto acolyte adding laser eyes to their profile picture and confidently declaring that so-called “no coiners” should “HFSP” (Have Fun Staying Poor). After a series of high-profile collapses in the space and relentless interest rate increases across the globe, Bitcoin and Ethereum are trading down more than 70% from their Q4 2021 peaks, and the Johnny-Come-Lately crypto fans have long since moved on to trading other markets after buying near the peak.
After this summer’s big crash, traders appear to have lost interest in Bitcoin and its rivals entirely. The BitVol gauge of volatility for Bitcoin has fallen sharply, and in an historically rare occurrence, the 30-day realized volatility in the cryptocurrency has fallen below that of the broad stock market. Meanwhile, Bitcoin’s trading volume has been more than cut in half since the start of the year. To call back to Wiesel’s quote above, if the frantic trading and record highs we saw last year represented “love” for the asset class, traders have moved beyond hate to indifference toward cryptoassets now.
For me, one of the most fascinating parts of the crypto market is the speed of its cycles. Whereas stock markets tend to see secular bull markets lasting 10-20 years followed by 5- to 10-year bear markets, cryptoassets have seen major bulls markets and crushing bear markets every couple of years, with major peaks developing in 2013, 2017, and now 2021. If you watch the space closely, you begin to see the same patterns in adoption, interest, and price action recur at a far faster rate than they do in more traditional markets.
From that perspective, Bitcoin’s current situation closely mirrors what we saw throughout 2018. After a euphoric peak in the fourth quarter of the previous year, Bitcoin had spent months bouncing along support at $6,000, putting in consistently lower highs along the way. Then, heading into the holiday season, that key support level finally broke as even the most diehard of fans threw in the towel on the asset class, leading to a quick 50% drop to near $3,000 that wiped out the bullish sentiment entirely and eventually paved the way for the next bull cycle.
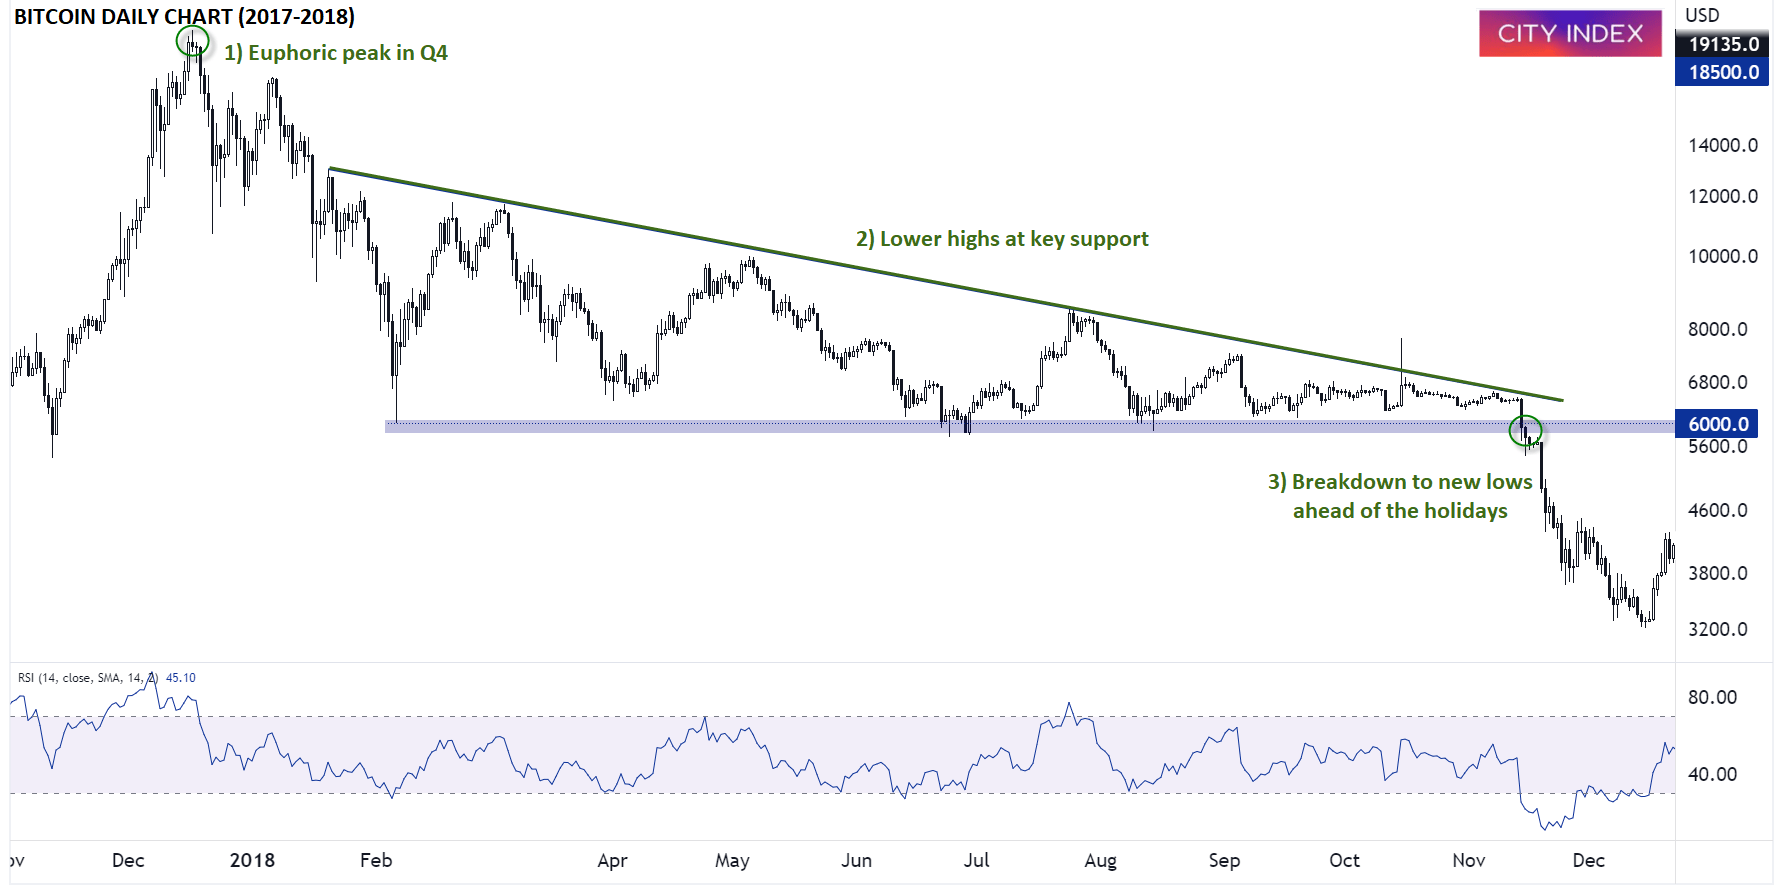
Source: TradingView, StoneX
While we always warn about the risks of putting too much stock into historical analogs, the similarities to the current situation are eerie. Bitcoin saw a euphoric peak at record highs in the fourth quarter of last year, and after collapsing to support in the $18,500 area, the cryptocurrency has spent the last several months bouncing along that support level, putting in lower highs along the way as interest in the asset class has faded heading into the holiday season:
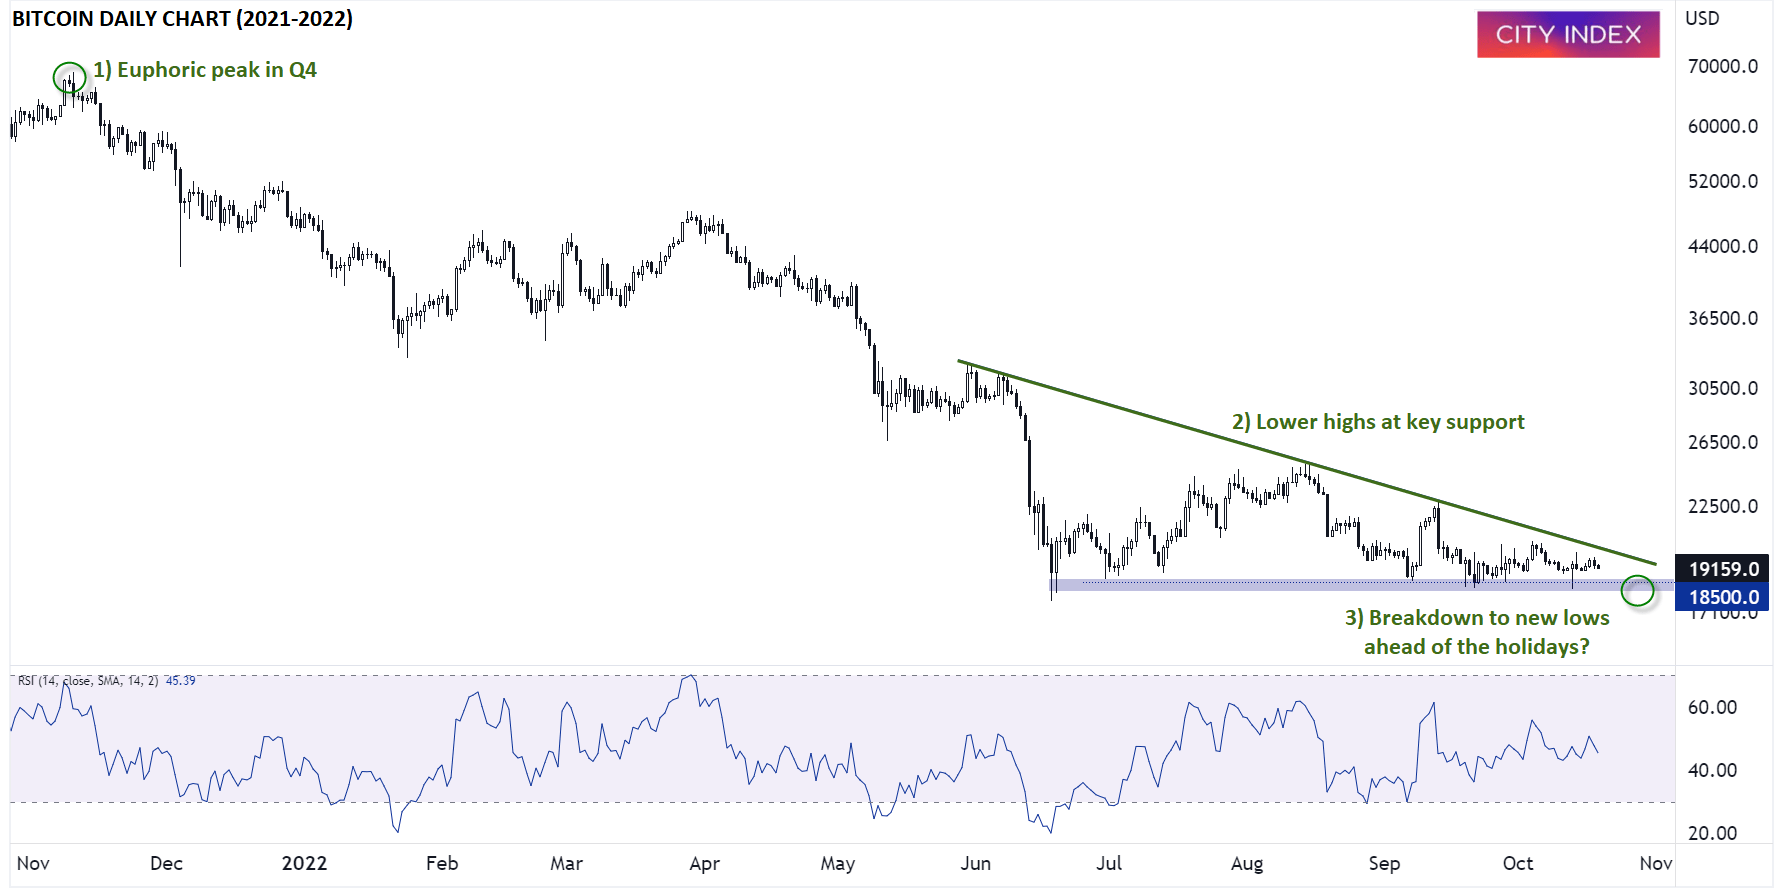
Source: TradingView, StoneX
Whether we ultimately see a similar washout to fresh lows below $18,500 remains to be seen, but the asset class’s (brief, but consistent) history suggests that such a move could be the proverbial straw the breaks the back of the last crypto bulls, paradoxically setting the stage for a new bull market to form in 2023 and beyond.
How to trade with City Index
You can trade with City Index by following these four easy steps:
-
Open an account, or log in if you’re already a customer
• Open an account in the UK
• Open an account in Australia
• Open an account in Singapore
- Search for the market you want to trade in our award-winning platform
- Choose your position and size, and your stop and limit levels
- Place the trade
Latest market news
Today 11:09 AM
Today 07:57 AM
Latest Bitcoin USD articles

April 24, 2024 05:45 AM
April 15, 2024 07:13 PM
April 9, 2024 01:15 AM

March 21, 2024 11:48 PM