


August 11, 2022 2:17 PM

This time last month, following the release of a shockingly high inflation print for June, Bitcoin found some inner resilience.
In this article here from July, it was noted that a red-hot inflation number has frequently been the catalyst for Bitcoin to break to the downside. However, despite the ensuing post CPI selloff in equities, Bitcoin closed 4.7% higher on the session, above $20,000.
Overnight the release of the July CPI inflation contained a downside surprise. Headline CPI printed flat vs 0.2% expected, leading the year-on-year rate low to 8.5%. Core CPI rose by 0.3% vs 0.5% expected, leaving the annual rate steady at 5.9%.
Despite the strong surge higher in equities, culminating in the highest closing price in the Nasdaq for three months, Bitcoin continues to lag. The last time the Nasdaq closed above 13,300 as it did overnight, Bitcoin was trading near $35,000.
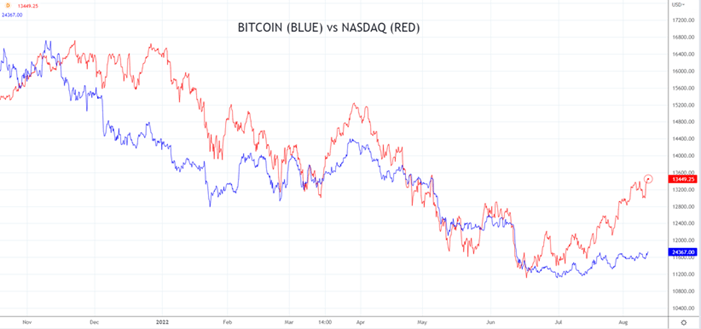
Why has the correlation between the Nasdaq and Bitcoin weakened?
After trading in lockstep with the Nasdaq in the first half of 2022, the correlation between the Nasdaq and Bitcoin is at its lowest level for some time.
While it’s impossible to say how long the breakdown may last (it could be days, weeks or even months), we can speculate why the breakdown has occurred.
One immediate explanation that springs to mind is that following the softer CPI data overnight, usually reliable Fed doves Kashkari and Evans reiterated that higher interest rates are required, and that rate cuts in 2023 are “unrealistic".
The prospect of higher interest rates in 2023 instead of the rate cuts the interest rate market is promising is a headwind to crypto.
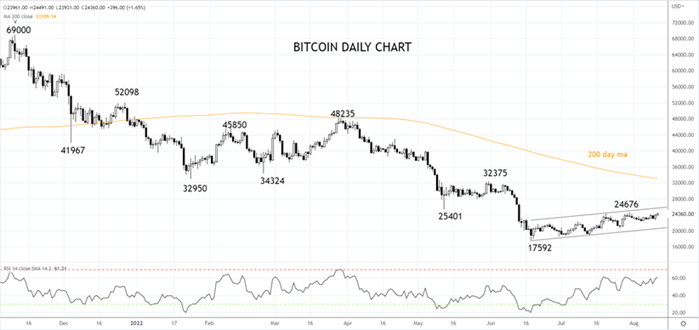
What do the charts say?
Technically we view the rally from the $17,952 low as corrective, which has the potential to test resistance at $25,400/700 (the May low and trend channel resistance).
A break and close below $20,500 would indicate the correction is complete and that a retest of the June low is underway.
Source Tradingview. The figures stated are as of August 11th 2022. Past performance is not a reliable indicator of future performance. This report does not contain and is not to be taken as containing any financial product advice or financial product recommendation
How to trade with City Index
You can trade with City Index by following these four easy steps:
-
Open an account, or log in if you’re already a customer
• Open an account in the UK
• Open an account in Australia
• Open an account in Singapore
- Search for the company you want to trade in our award-winning platform
- Choose your position and size, and your stop and limit levels
- Place the trade
Latest market news
Yesterday 01:32 PM
Yesterday 09:35 AM
Yesterday 07:23 AM
Yesterday 04:48 AM
Yesterday 12:17 AM
July 25, 2024 10:39 PM
Latest Bitcoin USD articles

July 20, 2024 07:00 AM


May 23, 2024 01:49 PM

May 21, 2024 06:30 AM