


July 14, 2022 5:36 PM

Overnight signs of resilience have emerged that indicate Bitcoin may be closer to a bottom than some may think.
Last month, the release of higher-than-expected U.S inflation numbers on June the 10th, provided the catalyst for Bitcoin to break below important support at $30,000 and then for Bitcoin to break its post-Terra crash $25,401 low.
The hot inflation number was also the catalyst for the Federal Reserve’s 75bp jumbo rate hike that followed on June the 16th. Two days later Bitcoin printed a fresh cycle low at $17,592.
Overnight U.S inflation once again came in hotter higher than expected. Headline inflation rose to 9.1%, while the run rate of core inflation re-accelerated to 5.9%, above the 5.7% expected.
The shockingly high inflation numbers postpone expectations for a dovish Fed pivot and have again raised the prospect of more aggressive Fed rate hikes.
In months gone past, this combination would have been enough to see Bitcoin fall into an abyss.
However, after initially falling 3% to a low of $18,905, Bitcoin closed 4.7% higher overnight at $20,230. An unexpected sign of strength and decoupling from the equity market.
Looking at what might be behind Bitcoins’ overnight resilience and whether it is sustainable, it is possible that Bitcoin has taken encouragement from a further flattening of the interest rate curve.
Although front-end yields rose overnight to reflect the possibility of a 100bp hike at the next FOMC meeting on July the 28th, the market now has interest rate cuts priced from February 2023. Lower rates provide support for speculative assets such as Bitcoin.
What do the charts say?
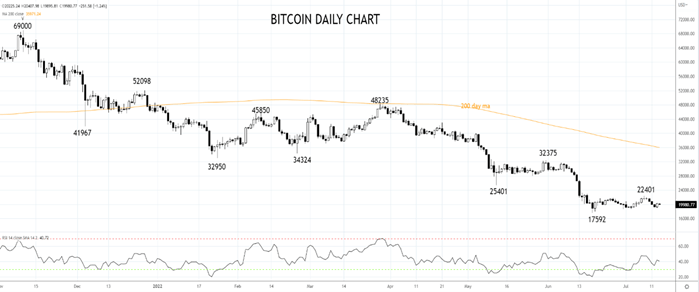
Technically Bitcoin remains in a downtrend. The rally from the $17,592 low of mid-June to the recent $22,401 high appears to be countertrend which suggests that a retest and break of the $17,592 low is likely.
However, if Bitcoin can break its trend of lower lows and lower highs and retake last week’s $22,401 high it would provide the basis for a stronger rally, initially back towards $28,000.
Source Tradingview. The figures stated are as of July 14th 2022. Past performance is not a reliable indicator of future performance. This report does not contain and is not to be taken as containing any financial product advice or financial product recommendation
How to trade with City Index
You can trade with City Index by following these four easy steps:
-
Open an account, or log in if you’re already a customer
• Open an account in the UK
• Open an account in Australia
• Open an account in Singapore
- Search for the company you want to trade in our award-winning platform
- Choose your position and size, and your stop and limit levels
- Place the trade
O
Latest market news
Yesterday 01:32 PM
Yesterday 09:35 AM
Yesterday 07:23 AM
Yesterday 04:48 AM
Yesterday 12:17 AM
July 25, 2024 10:39 PM
Latest Bitcoin USD articles

July 20, 2024 07:00 AM


May 23, 2024 01:49 PM

May 21, 2024 06:30 AM