
USD/JPY, Japanese Yen Talking Points:
- USD/JPY has pushed up for yet another resistance test at 147.69. This is a level that I’ve been discussing in webinars of late and it came back into the picture last Tuesday.
- Since that re-entrance of resistance on Tuesday, Sept. 5th, there have been multiple inflections at that level. On Thursday of last week this allowed for a pullback to support at 146.65, which saw prices shoot back up to re-test 147.69 by the weekly close. And then earlier this week bears made a bit more ground but again, bulls returned to push price up for another re-test of 147.69.
- I’ll be discussing these themes in-depth in the weekly webinar on Tuesday at 1PM ET. It’s free for all to register: Click here to register.
USD/JPY has become a focal point for many FOREX traders as the bullish trend has continued to push fresh highs, reminiscent of the massive bullish trend from last year that eventually topped around the 150 level in the pair.
The difference is that this time, we have the recent history of an intervention that ended up reversing the trend, so as we push closer and closer to the 150 level that seemed to spark everything last year, bulls have remained hesitant. And as of late last week, we’ve even started to see signs of Japanese policymakers responding, first with a veiled threat of intervention last week and then with the teased possibility of rate hikes earlier this week.
On net, bulls have remained somewhat undeterred. We did see a pullback after the intervention threat last week, but support held at the 146.65 Fibonacci level and bulls simply pushed price back up to resistance at 147.69 before the close of last week’s trade.
Another pullback developed around this week’s open, but this time it was the mere mention of possible rate hikes from BoJ Governor, Kazuo Ueda. This helped to prod another pullback in the pair and this time bears were able to push back-below 146 but, again, they were unable to run with the move as bulls simply came into hit the bid and push prices right back to 147.69.
That most recent resistance hit with that level showed this morning and it’s again held bulls at bay.
USD/JPY Daily Price Chart
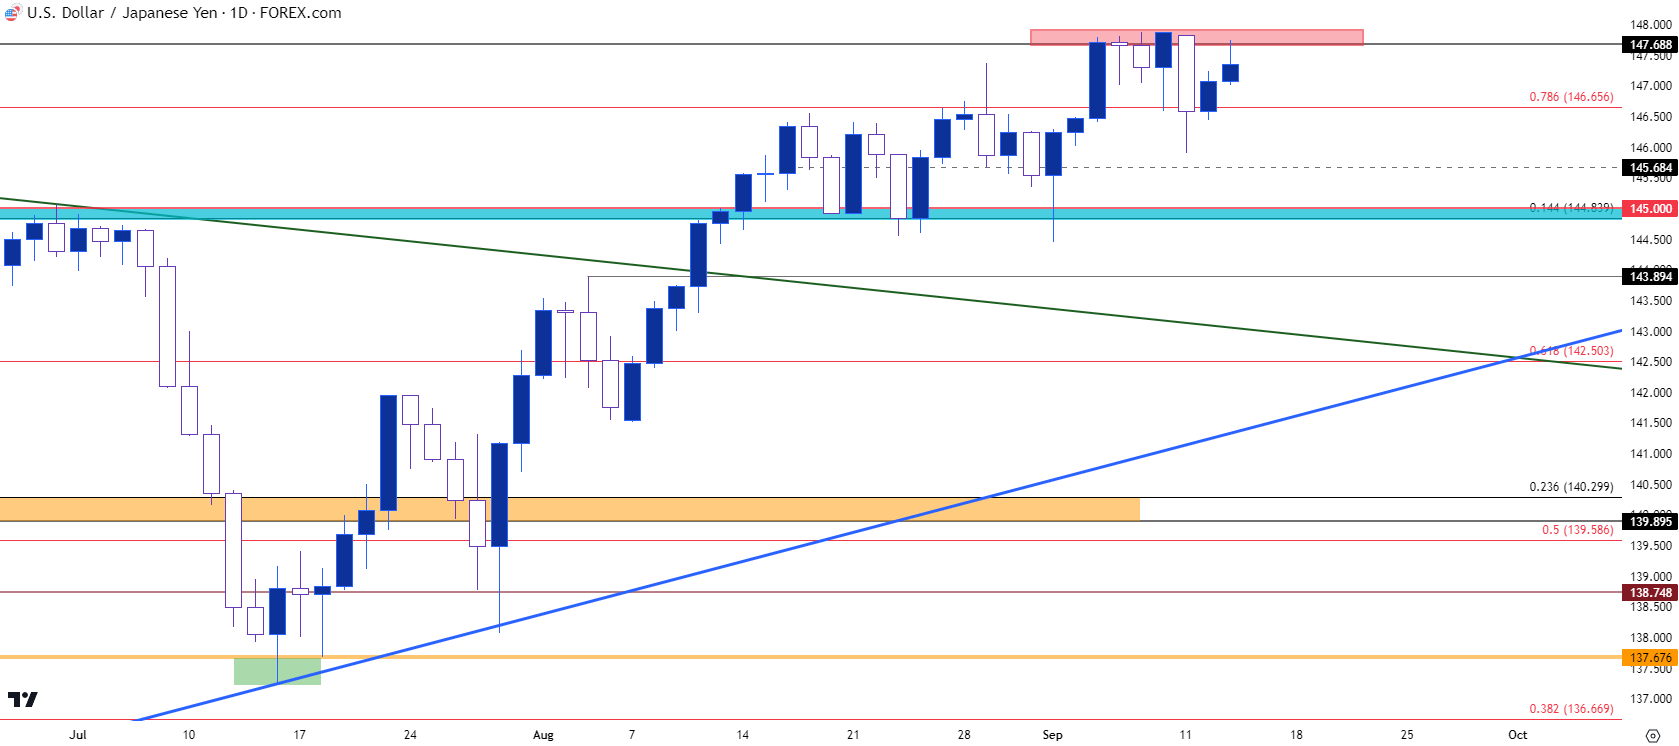 Chart prepared by James Stanley, USD/JPY on Tradingview
USD/JPY: Carry Drive v/s Intervention Worry
The bullish trend in USD/JPY was 21 months old when the Bank of Japan finally intervened last year. And the timing turned out to be excellent as it was just after DXY had started to pullback from the 30-year-high that it had just set.
Initially the announcement of intervention brought a mere pullback to the pair. But with price resting at a lower-low, the follow-through response from bulls at support was up to a lower-high, and the next time that price pushed back for a re-test of support the bottom fell out and the pair continued to trend lower into the end of the year. It took only three months to erase 50% of the move that had taken 21 months to build, with support finally showing at the 50% retracement of that major move in January of this year.
Since then? It’s been a mostly bullish picture with buyers tacking on another 2,000 pips to the quote; but now that we’re back in the same vicinity where the BoJ had intervened last year the question has naturally arisen as to whether they’d do it again.
This was made a bit more real last week when we heard from Masato Kanda, warning speculators that Japanese policy makers would be watching moves in the FX market. That helped to produce the initial pullback from resistance at 147.69, but price found support shortly after and pushed right back to up to resistance.
This week started with Kazuo Ueda discussing possible rate hikes, which could be a game-changer for that theme. That’s one possible difference here as last year didn’t really carry the same potential for change in Japanese monetary policy, particularly with Haruhiko Kuroda nearing his final months at the helm of the bank. This could be a massive item of change if it does continue to develop because last year’s intervention was, in essence, the Bank of Japan burning finite capital reserves to support a trade opposing their own monetary policy. But it’s not a move without consequence, as the BoJ is sitting on a trove of Japanese Government Bonds after almost a decade of stimulus following the introduction of ‘Abe-nomics,’ and a rising rate cycle could cause considerable turmoil down the road.
At this point the BoJ’s policy of low interest rates continues to encourage Yen-weakness, as carry trades have remained alive in many JPY-based pairs, USD/JPY included. That helps to explain the long side and the motivation for bulls in USD/JPY. But, if the prospect of principal losses is there, whether its on the back of an intervention announcement or the possibility of higher rates, that can influence traders to move away from the carry, very similar to what was seen in October and November of last year when USD/JPY was going in reverse.
And if we do have a crowded trade unwinding, the velocity could be significant, again, very similar to what we saw last Q4 in USD/JPY. The question is for how long the BoJ might be willing to allow the trend to push, and we know of one line-in-the-sand already at 147.69.
USD/JPY Weekly Price Chart
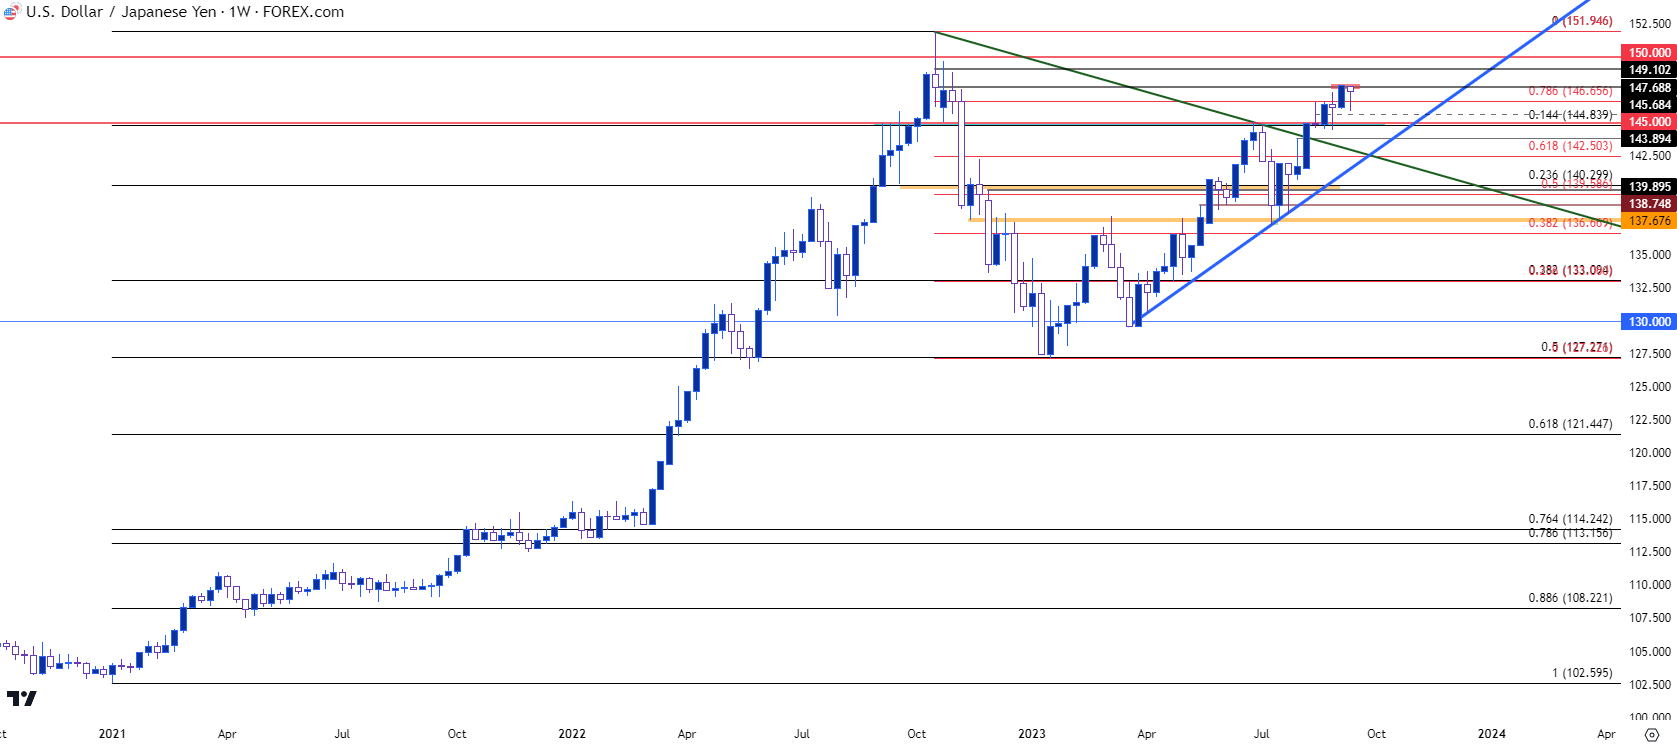 Chart prepared by James Stanley, USD/JPY on Tradingview
--- written by James Stanley, Senior Strategist
Latest market news
Today 10:37 AM
Today 08:25 AM
Latest Trade Ideas articles


Today 10:37 AM

Today 08:25 AM
