

Key takeaways
- USD/JPY has pulled back form its 6-month high, with 140 currently being defended in the Asian session
- A break below 139.45 could see it pull back towards a volume cluster around 138.50
- Until then, we see the potential for a swing low to form, but whether it is a minor rally or break to new cycle highs is down to this week’s data
- Plenty of data for USD/JPY this week including US employment (JOLTS, ADP, jobless claims, layoffs and NFP), ISM manufacturing and consumer confidence
- Japan releases retail sales, industrial production and household confidence data on Wednesday
With the 3-day weekend for the US and UK in the rear-view mirror, we can look forward to replenished trading volumes for major exchanges. The low-liquidity environment has allowed the US dollar rally to pause for breath and any market against it to regroup. So a key question as economic data begins to pick up is whether the dollar needs more of a pullback from current levels, or it simply wants to trade higher for a fourth week.
As things stand, Fed Fund futures imply a 63% chance of a 25bp Fed hike in June, which is more than triple than it was just over a week ago. And as investors are still coming around to the Fed not pausing, we could find that they are more sensitive to strong US economic data to justify a hike. In particular, traders would be wise to keep an eye on employment data such as JOLTS job openings, Challenger layoffs, ADP employment and jobless claims data as it could easily sway opinions for Friday’s Nonfarm payroll report on Friday (and therefor Fed policy).
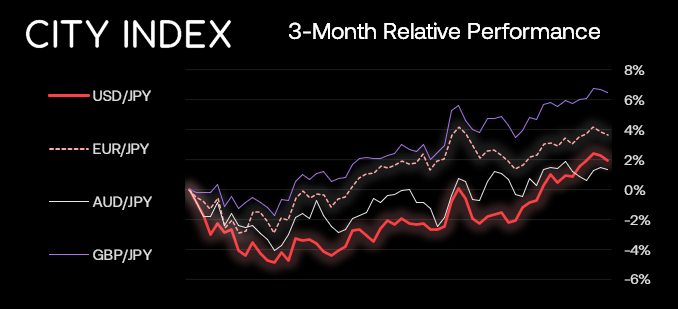
Earlier today we saw the yen strengthen slightly across the board as Japan’s Finance Minister hinted at higher corporate tax, by saying fiscal policy should be more in line with international standards. But with the initial knee-jerk reaction out of the way, we can remember that we have a hawkish Fed coupled with an ultra-dovish BOJ, which is the divergent theme currency trends rely upon.
USD/JPY daily chart:
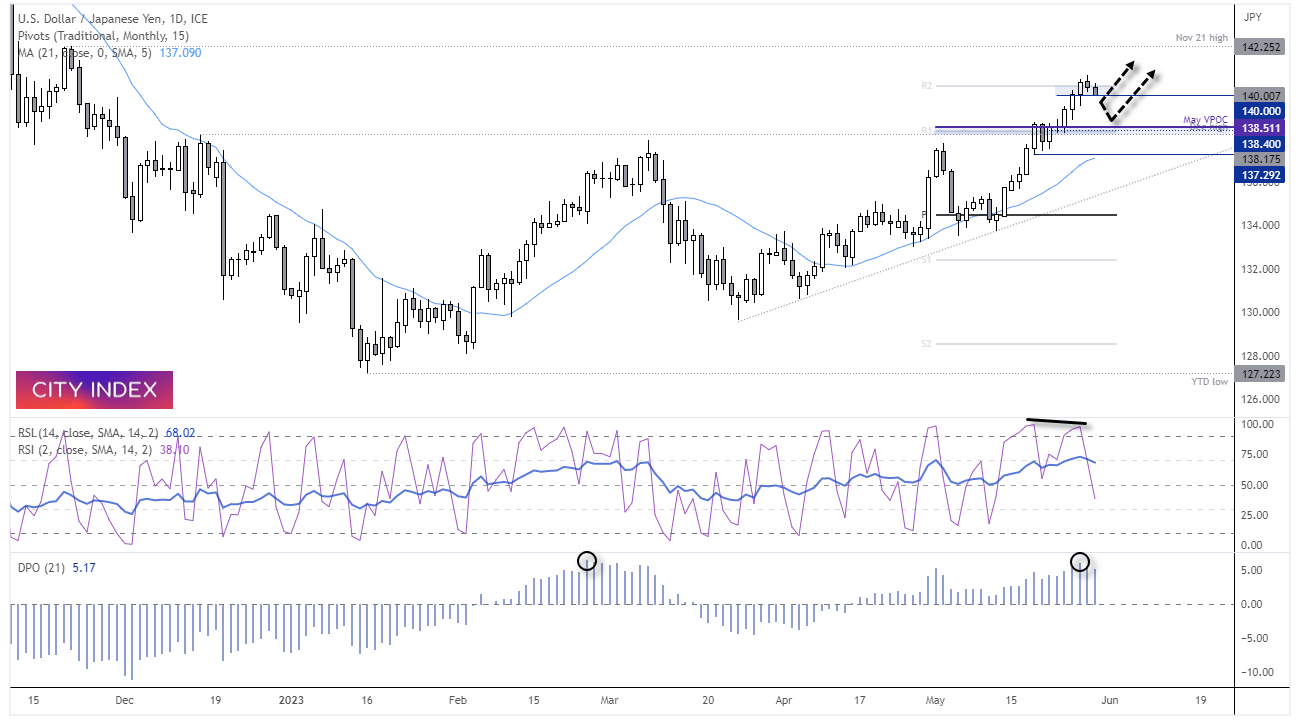
I think we can all agree that USD/JPY has produced a decent trend on the daily chart, thanks to a combination of a stubbornly ultra-dovish BOJ, stronger US economic data and fresh bets that the Fed may actually hike by another 25bp in June. USD/JPY printed a fresh YTD high on Monday before turning lower during low-liquidity trade, as the US dollar’s rally paused for breath. With prices now probing 140 at the time of writing, we’re left to consider its potential for a deeper retracement.
Whilst the fundamentals could justify a higher USD/JPY, technically a retracement could also be justified over the near-term. Bulls may therefore want to be cautious at the highs on the daily timeframe to avoid being caught near a potential cycle high.
The DPO (detrend price oscillator) has a level which preceded the March high. The RSI (14) has reached oversold above 70, and the RSI (2) has produced a bearish divergence within its oversold zone (above 90). Whilst indicators such as the DPO and RSI do not necessarily act as ideal timing tools, they do at least ‘indicate’ the potential for mean reversion.
Furthermore, the rally has also stalled around the monthly R2 pivot point, and the closer we move to the 142.25 high, the more tempted bulls could be to book a profit (or bears fade the move) which could at least see a shakeout at the highs, if not a retracement.
With that said, take note of the heavy trading activity around 138.51 for the month of May. The closer we get to this level, the grater the odds that bulls already long at such levels may come to support prices to potentially form a higher low.
USD/JPY 1-hour chart
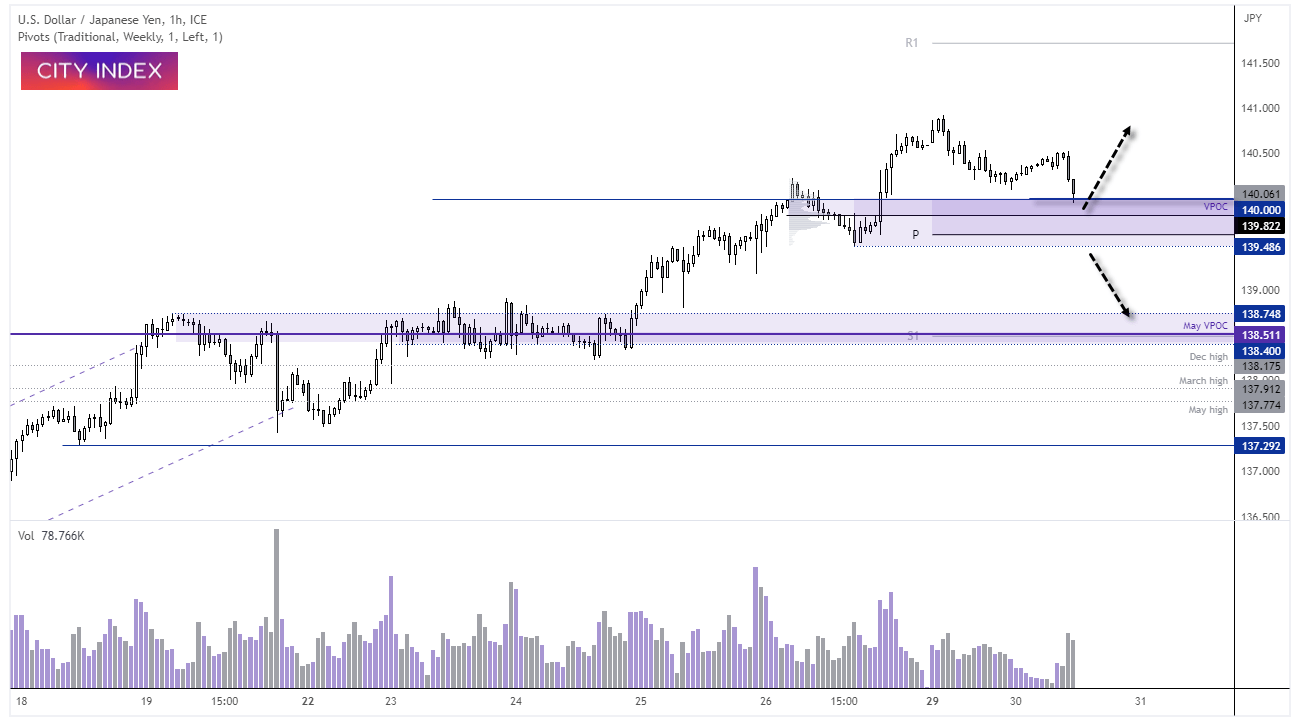
Prices are continuing to pull back on the 1-hour chart, and volumes re increasing to suggest initiative selling of larger players. Yet 140 (a nice round number) is providing support, and holding above 139.82 which is the highest traded level during its pullback on Friday. We also have the weekly pivot point at 139.16 and the 139.48 low, therefor the odds of a swing low occurring appear to be relatively high. What we’re less sure of is whether it can break to new high in line with the trend, or only make a partial effort.
Either way, incoming data remain key. From the US we have consumer confidence later today, JOLTS job openings, ADP employment and jobless claims data on Wednesday (which act as a nice prelude to Friday’s Nonfarm payrolls report). Whereas Japan releases industrial production, retail sales and household confidence data on Wednesday and Capex on Thursday (local time).
-- Written by Matt Simpson
Follow Matt on Twitter @cLeverEdge
How to trade with City Index
You can trade with City Index by following these four easy steps:
-
Open an account, or log in if you’re already a customer
• Open an account in the UK
• Open an account in Australia
• Open an account in Singapore
- Search for the market you want to trade in our award-winning platform
- Choose your position and size, and your stop and limit levels
- Place the trade
Latest market news
Yesterday 01:32 PM
Yesterday 09:35 AM
Yesterday 07:23 AM
Yesterday 04:48 AM
Yesterday 12:17 AM
July 25, 2024 10:39 PM
Latest Trade Ideas articles

Yesterday 09:35 AM

Yesterday 12:17 AM

July 25, 2024 10:39 PM

July 25, 2024 05:30 PM