June 6, 2022 7:37 PM

US 10 Year yields are up for the 6th consecutive day after news from China has led to optimism in the markets and, therefore, bond selling. Shanghai is up and running again in full force and restrictions are being lifted in Beijing. In addition, China said it will end an investigation into Didi (China’s version of Uber) and the app will soon be available again on mobile platforms. Bond traders took the view that the “the glass is half full” and sold bonds, pushing 10-year yields back above 3.00% to their highest levels since May 11th. Resistance is at the May 11th highs of 3.07%, and then the highs from May 9th at 3.07%. If yields break above there, they can move to the highs from November 2018 at 3.25%. If the resistance holds, yields can fall to support at the May 26th lows of 2.71%. Below there, the next support level is the 38.2% Fibonacci retracement level from the lows of March 7th to the highs of May 9th at 2.62%, then horizontal support at 2.56%. Notice on the bottom panel of the chart below that the correlation coefficient between US 10-year yields and USD/JPY has a strong positive correlation at +0.92. Readings above +0.80 are considered strong. Therefore, if US yields are to continue to move higher, USD/JPY should move higher as well.
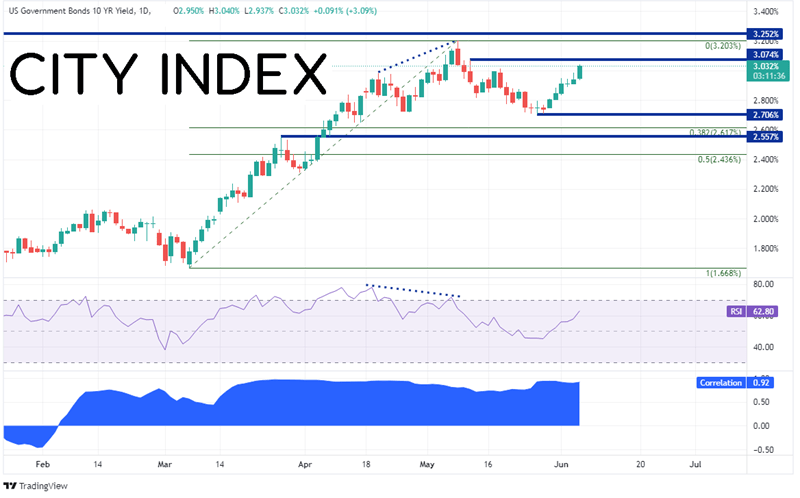
Source: Tradingview, Stone X
Trade US 10 Year bonds now: Login or Open a new account!
• Open an account in the UK
• Open an account in Australia
• Open an account in Singapore
Indeed, USD/JPY has been moving higher. On a daily timeframe, price formed a descending wedge pattern after the pair reached its highest level since April 2002 at 131.28 on May 9th. USD/JPY broke out of the descending wedge on May 31st after holding the 50 Day Moving Average support, and it hasn’t looked back. Today, USD/JPY took out the highs from May 9th and is banging up against horizontal resistance dating to February 2002 near 131.84. The next resistance levels are at the 127.2% and 161.8% Fibonacci extensions from the highs of May 9th to the lows of May 24th near 132.70 and 134.43, respectively. Above there, horizontal resistance from the highs of January 2002 cross at 135.16. If the resistance holds, support below isn’t until the 50 Day Moving Average at 127.52. The next support level is the top, downward sloping trendline from the descending wedge near 126.75, then the lows from May 24th at 126.36.
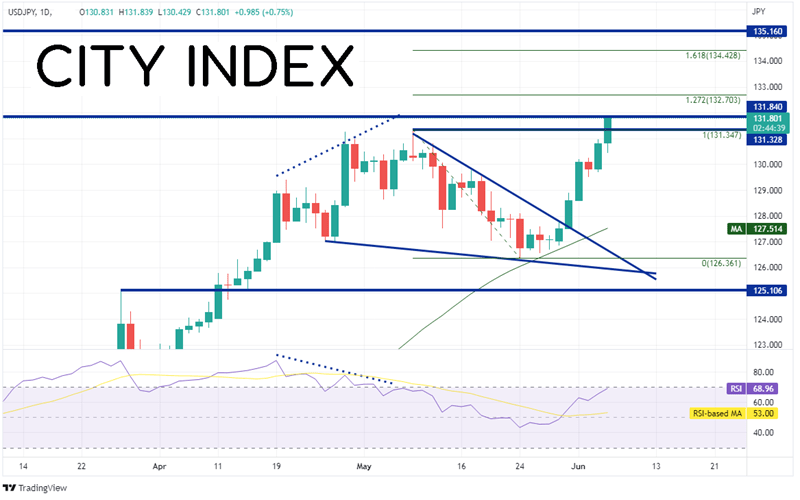
Source: Tradingview, Stone X
Trade USD/JPY now: Login or Open a new account!
• Open an account in the UK
• Open an account in Australia
• Open an account in Singapore
US 10-year yields and USD/JPY have a strong, positive correlation with a correlation coefficient of +0.92. Both have been moving aggressively higher, with USD/JPY reaching its highest level today since 2002! Will it continue to move higher? It may depend on what US bond traders decide to do!
Learn more about forex trading opportunities.
Latest market news
Yesterday 01:32 PM
Yesterday 09:35 AM
Yesterday 07:23 AM
Yesterday 04:48 AM
Yesterday 12:17 AM
July 25, 2024 10:39 PM
Latest Forex articles

Yesterday 12:17 AM

July 25, 2024 10:39 PM

July 25, 2024 03:59 PM

July 25, 2024 04:37 AM