September 27, 2022 5:12 PM
The S&P/Case-Schiller Home Price Index increased 16.1% YoY in July vs an expectation of 17% and a June reading of 18.7% YoY. This is the 3rd month in a row that price has fallen on a year-over-year basis and the lowest price increase since April of 2021. In addition, on a monthly basis, the index fell 0.6% vs an expectation of +0.1% and a June reading of +0.1. This was the first decrease on a monthly basis since 2019. Meanwhile, the number of new home sales increased by 28.8% in August from -8.6% in July. One of the biggest reasons for the increase in new home sales may be due to an expected increase in mortgage rates. In August, mortgage rates averaged 5.59%. For the week ending September 23rd, mortgage rates on a 30-year fixed rate mortgage were up to 6.25%! Last week, Existing Home Sales for August fell by only 0.4% MoM. The last time the number of existing home sales increased in the US was January! However, August’s print was also the smallest decrease since January, perhaps also suggesting that people were rushing to buy houses ahead of a mortgage rate increase.
US 10-Year yields rose today to 3.974%. This is the highest level since April 2010 when yields reached a high of 3.990%. This suggests that US mortgage rates will be rising as well. However, notice that the RSI on the weekly timeframe is in overbought territory, suggesting that yields may be ready for a short-term pullback.
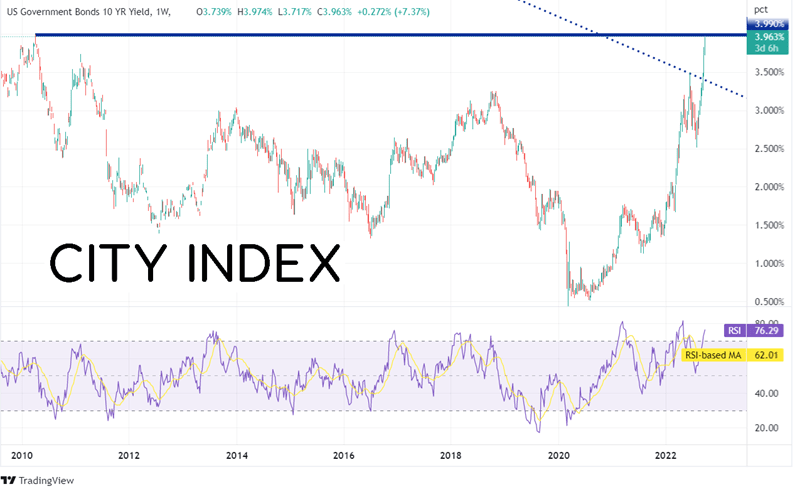
Source: Tradingview, Stone X
Trade US bonds now: Login or Open a new account!
• Open an account in the UK
• Open an account in Australia
• Open an account in Singapore
Notice in the bottom panel of the chart below that USD/JPY and 10-year yields currently have a strong positive correlation at +0.88 on a 240-minute timeframe. Correlation coefficients of +0.80 or higher are considered strong, therefore the two correlated assets are expected to move in the same direction. This may give markets a clue as to where yields may be headed next. After Japan intervened in the markets on September 22nd, USD/JPY moved from 145.90 down to 140.35. The correlation fell out of favor as yields did not follow USD/JPY lower. However, USD/JPY has been moving higher off those lows, and is only 120 pips for the intervention levels, resulting in a return of the positive correlation. Initial resistance in USD/JPY is at the recent highs of 145.90. Above there is a confluence of resistance consisting of the top trendline of a rising longer-term channel and the 127.2% Fibonacci extension from the recent highs at 145.90 to the intervention lows at 140.25, near 147.11. Above there is the 161.8% Fibonacci extension from the same timeframe near 149.33. First support is at the initial bounce after the intervention near 142.50, then the intervention lows at 140.35. Below there, price can fall to horizonal support near 139.00.
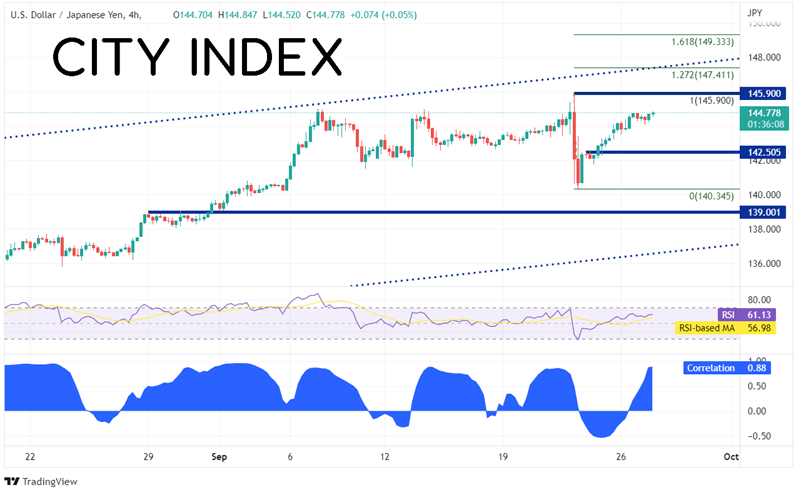
Source: Tradingview, Stone X
Trade USD/JPY now: Login or Open a new account!
• Open an account in the UK
• Open an account in Australia
• Open an account in Singapore
Housing prices continue to fall, while the number of new home sales increased, and the number of existing home sales only fell slightly. This increase in sales may have been people rushing to buy ahead of higher mortgage rates. Mortgages rates are based of the 10-year bond, whose yields have been screaming lately. In addition, since the BOJ intervention, USD/JPY and 10-year bond yields have been strongly correlated. If this correlation continues to hold, perhaps watching USD/JPY could give a clue as to where mortgage rates may be headed next!
Learn more about forex trading opportunities.
Latest market news
Yesterday 01:32 PM
Yesterday 09:35 AM
Yesterday 07:23 AM
Yesterday 04:48 AM
Yesterday 12:17 AM
July 25, 2024 10:39 PM
Latest Trade Ideas articles

Yesterday 09:35 AM

Yesterday 12:17 AM

July 25, 2024 10:39 PM

July 25, 2024 05:30 PM