

U.S. Dollar Talking Points:
- The U.S. Dollar put in a breakout yesterday and this continues the bullish sequence that’s built so far in 2024.
- In the day after, comments from Fed officials don’t sound too alarmed by the persistence of inflation, even with Core CPI flattening out around the 4% mark over the past 5-6 months. As we’ve seen so far in early-2024 trade, those dovish comments could give pullback into this bullish structure. The big question, at that point, is when or where bulls step in to hold higher-lows, as we saw at 104 last week. In the webinar, I looked at three different nearby support levels, after which the 200-day moving average comes back into the picture.
- I’ll be discussing these themes in-depth in the weekly webinar. It’s free for all to register: Click here to register.
U.S. inflation remains brisk as taken from yesterday’s CPI report, which furthers the strength that was seen in the earlier-month NFP report with the unemployment rate sticking at 3.7%. With the Fed’s dual mandate, that makes for a difficult backdrop to justify cuts, yet markets are still expecting four 25 bp cuts by the end of year, or perhaps even more. The Fed has so far highlighted three possible rate cuts but even that seems a distant concept with economic data remaining as strong as it has.
Nonetheless, yesterday’s CPI report served a quick jolt to markets. The U.S. Dollar rallied to a fresh two-month high and Treasury rates jumped, as well. There was a pullback in stocks but that, so far, has been short-lived as it provided pullback opportunity in some of the hot names that have driven the recent rally, such as NVDA. The fact that the stock only traded below the $700 handle for a few minutes after the open, before it was bid back up to resistance, illustrates just how strong sentiment remains to be and a likely source of that is the continued dovish posture of the Fed, even in light of strength in U.S. economic data.
In the U.S. Dollar, the currency continued the trend that’s built so far this year with yesterday providing another fresh high. Resistance held at the 104.78-105.00 area, which was last in-play as support in early-November; and that’s so far held bulls at bay.
In the webinar I took a similar look at DXY as I had the week before, where the bullish structure kept the door open for continuation with a big test around when or where bulls re-entered the picture. When I looked at this last week, the 200-day moving average seemed a logical spot for that to take place, if the pullback could run that deep. It did not though, as higher-lows held at the 103.98 Fibonacci level and that support remained for five days until yesterday’s breakout.
That’s now the higher-low for bulls to defend, and there are three swings above that which remain of interest for possible continuation, at 104.63, 104.43 and then 104.21. After that, we have the same 103.98 swing and then the 200-day plots at around 103.67. With U.S. retail sales due tomorrow and U of M sentiment on Friday, there’s a lot of potential for swings to develop here with the overriding question of when or where bulls might try to defend the trend.
U.S. Dollar Daily Price Chart
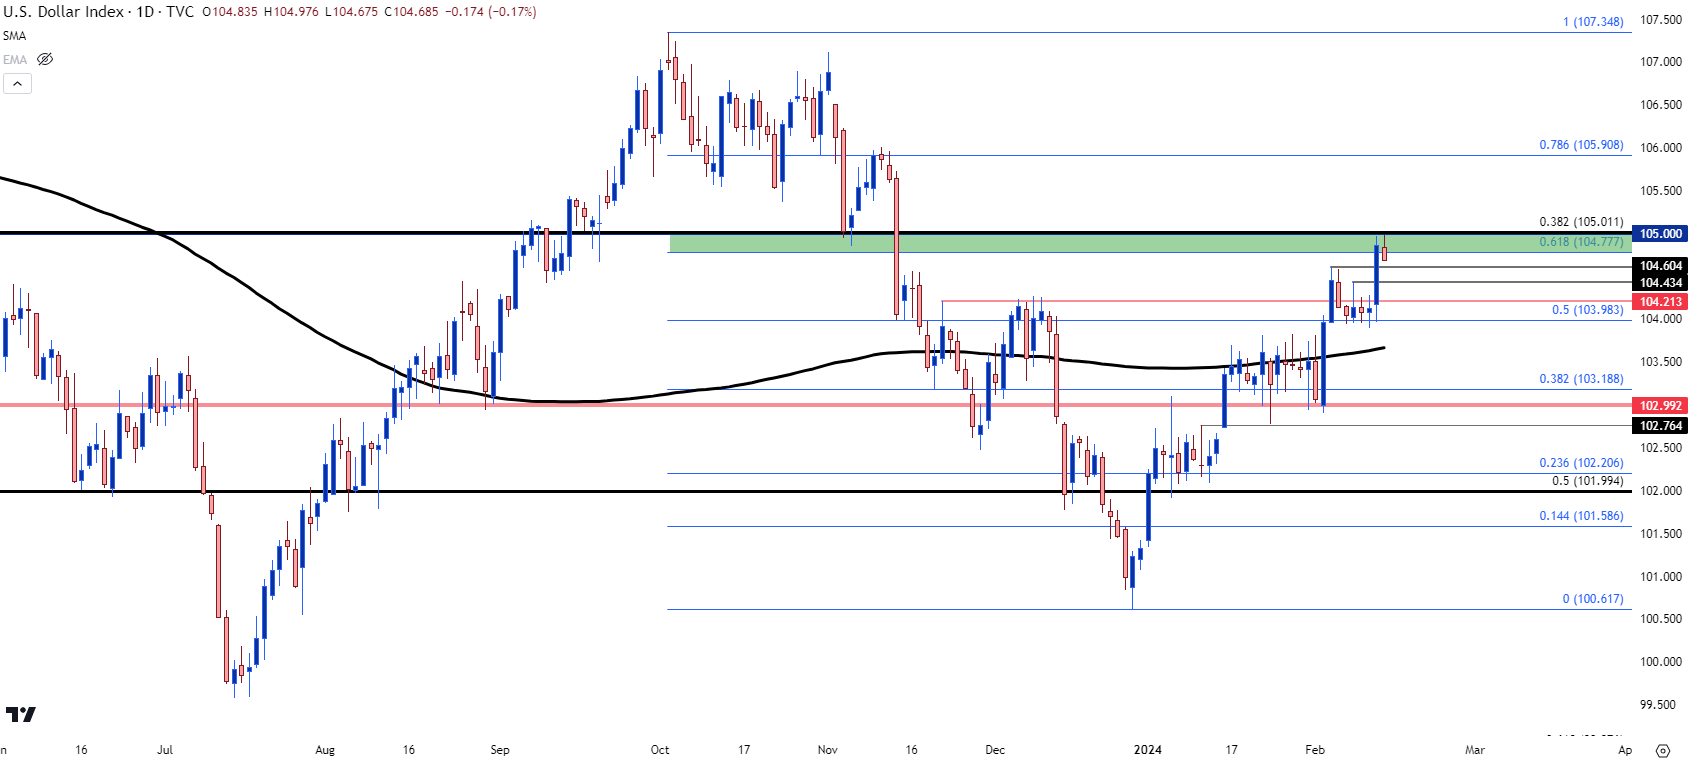 Chart prepared by James Stanley; data derived from Tradingview
EUR/USD Range, Stall at Lows
With the Euro making up 57.6% of the DXY quote, its reasonable to look into EUR/USD to investigate trend potential in the U.S. Dollar. And much as we saw the DXY move stall at 105.00, the EUR/USD move has so far stalled around the 1.0700 handle.
Perhaps more relevant here is the longer-term look, with the pair remaining in a range as has been the case for more than a year now.
EUR/USD Daily Chart
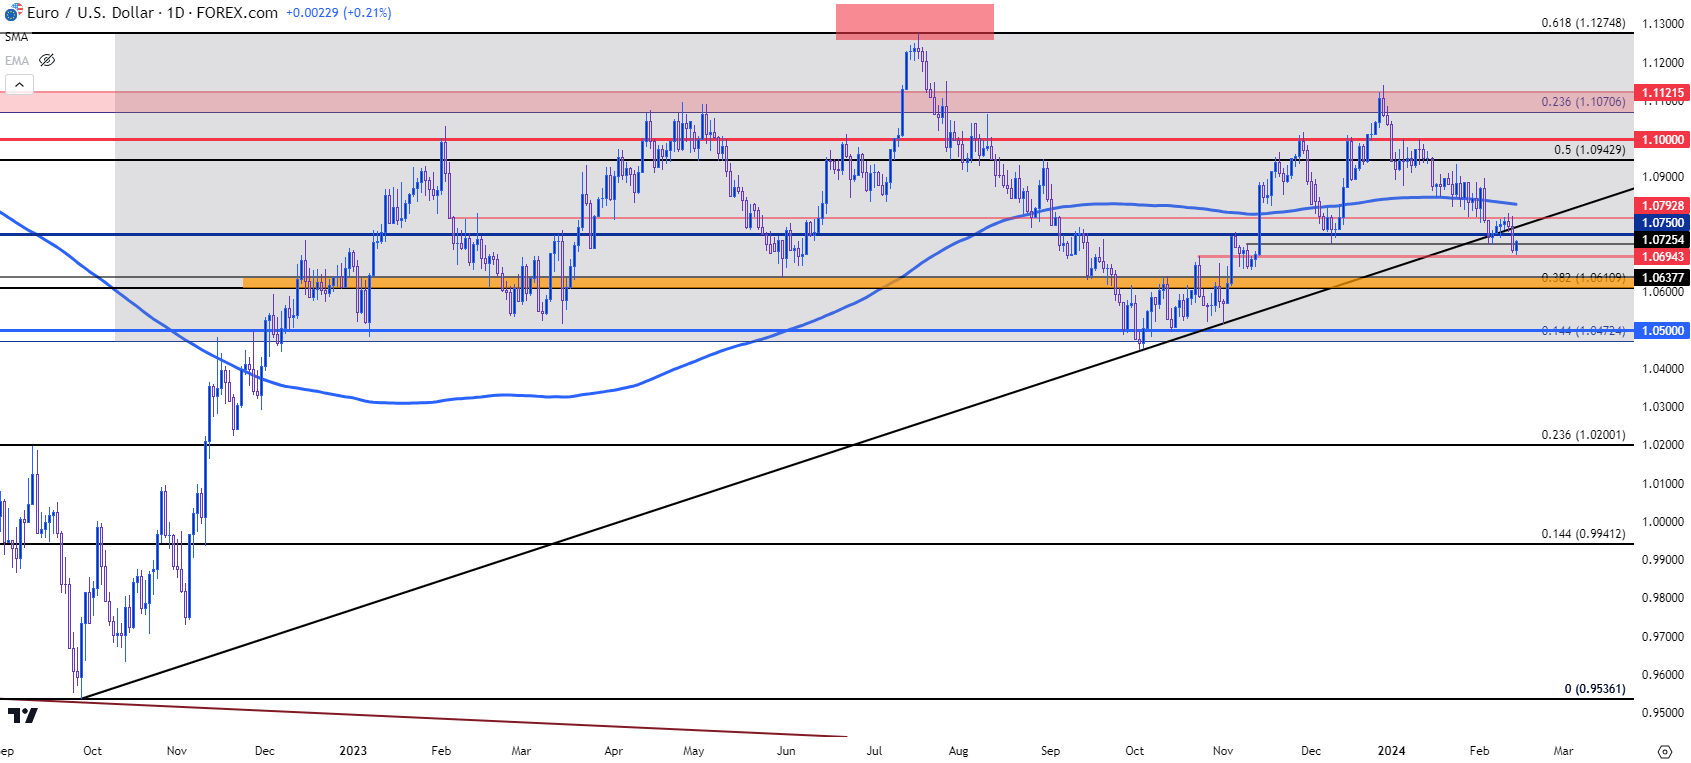 Chart prepared by James Stanley, EUR/USD on Tradingview
Shorter-Term EUR/USD
On a shorter-term basis bears have been struggling to make any significant pushes to fresh lows. The 1.0725 swing held a mild bounce last week, and when that was broken bears were only able to get an extra 30 pips of excursion before another support bounce began to show. Given proximity to longer-term range support, combined with that generally-dovish take from what we’ve heard from Fed members so far, and that can make sense. But, as I had noted in the webinar, bears’ reticence to drive further while testing lows or while near support is what can lead to a falling wedge type of scenario.
This highlights resistance potential for bears to track for continuation purposes, and there’s a few spots of note to track that at 1.0750, 1.0792 and then the 200-day moving average which currently plots around the 1.0830 level.
EUR/USD Four-Hour Price Chart
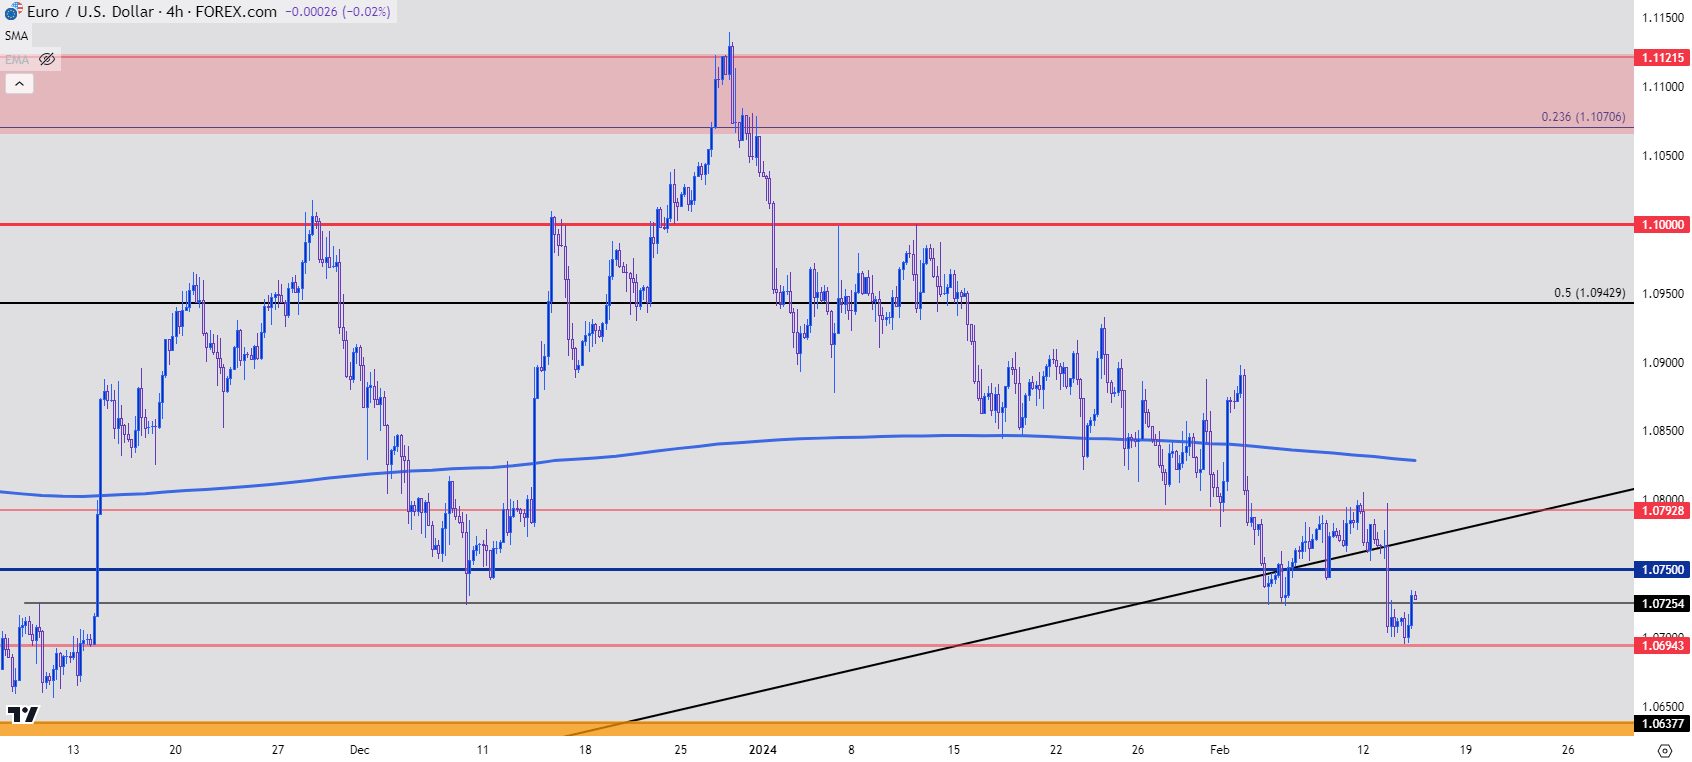 Chart prepared by James Stanley, EUR/USD on Tradingview

Gold
Spot gold finally pushed below the $2k psychological level after the CPI report yesterday, and this is the first such instance since the December FOMC rate decision. I remain of the mind that gold does have the ability to spark bullish trends above $2k, but I think that happens after the Fed formally pivots and yesterday’s data is another reminder that this isn’t yet close. The big question now is whether bearish structure can continue to develop, and at this point, there’s resistance potential at the $2k level, after which $2,018 comes into the picture.
For next supports, there’s a confluent zone around the Fibonacci level at 1975, after which the 200-day moving average comes into the picture. Below that, we have the zone from where the trend pivoted in November, around the 1932-1938 spot on the chart.
XAU/USD (Gold) Daily Price Chart
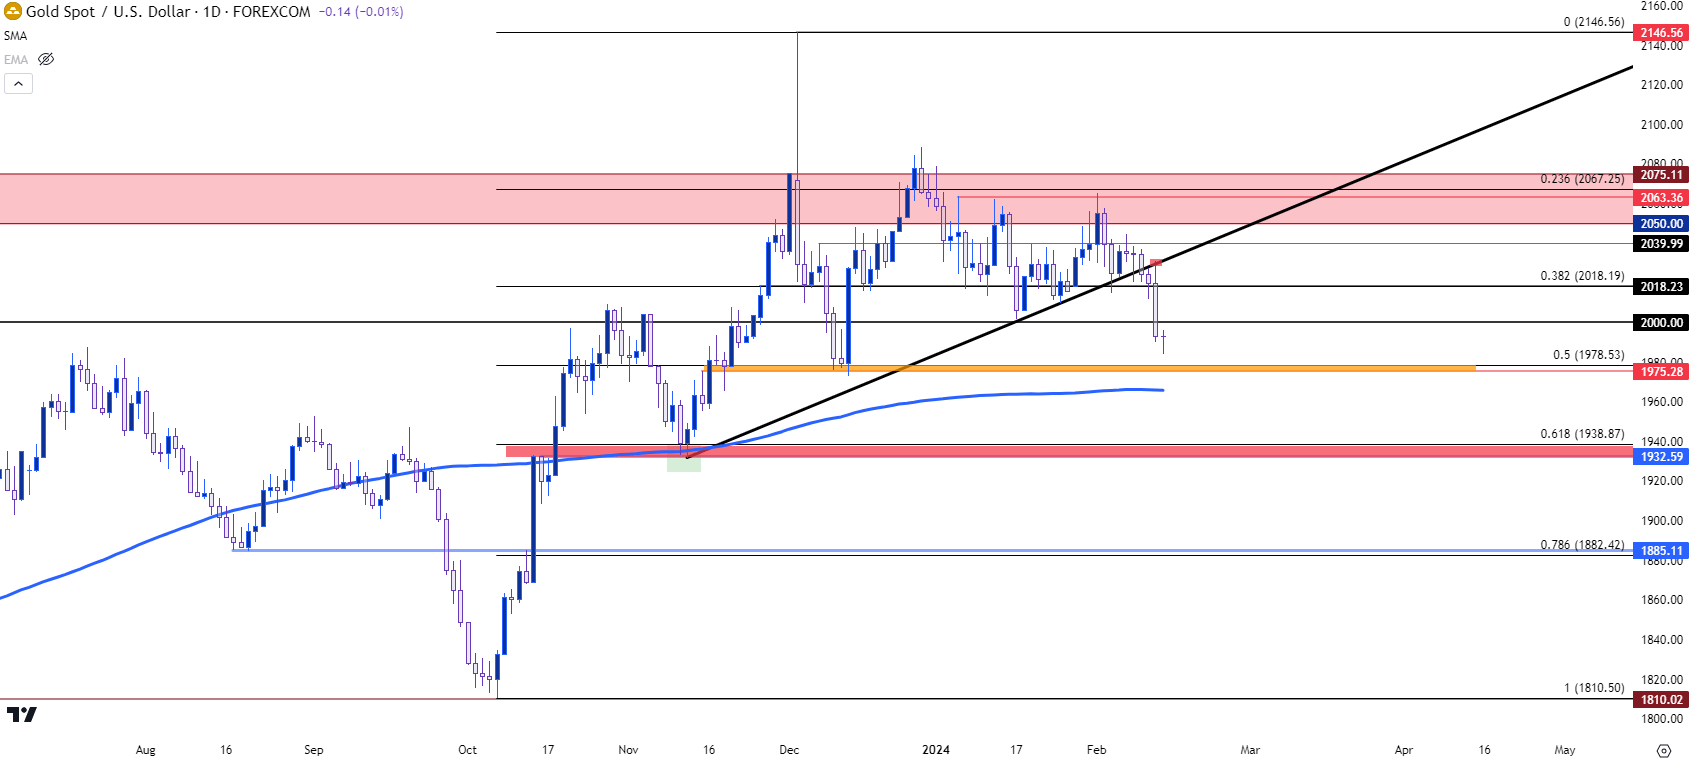 Chart prepared by James Stanley, Gold on Tradingview
Bitcoin
In the webinar I highlighted some of the interesting shifts that’s shown between gold and Bitcoin going back to the summer of 2020. At the time, the Fed was heavily stimulating markets through Covid shutdowns and gold put in a strong topside move, eventually testing above the $2k level for the first time ever. But, bulls couldn’t get too far beyond that and, eventually, gold started pulling back and selling off. At the time, Bitcoin was struggling to get back above the $12k figure.
As gold continued to sell-off, strength showed in Bitcoin in a very big way and that theme remained despite the heavy hand from the Fed. More recently, as gold has stalled around the $2k figure we’ve seen strength show back-up in Bitcoin and after the 50k level held resistance on Monday, the CPI-fueled pullback found support at the Fibonacci level of 48,555. That helped to hold the lows and Bitcoin went right back above 50k and, this morning, found resistance at a familiar level of 52,099.
That’s held the high thus far and similar to earlier this week, bullish trend potential remains and now that 50k level presents as possible support.
Bitcoin (BTC/USD) Four-Hour Price Chart
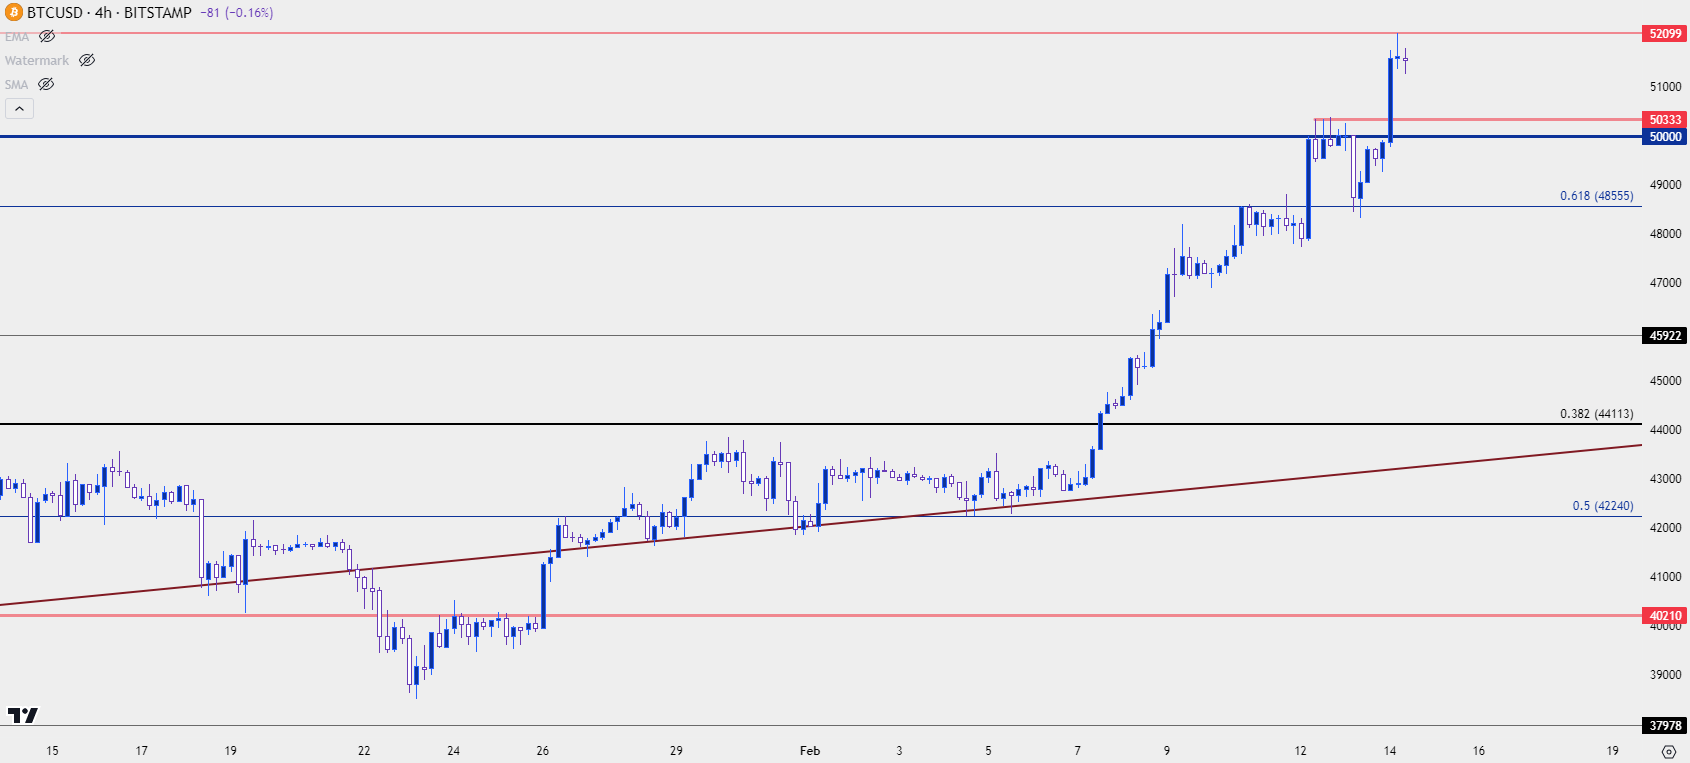 Chart prepared by James Stanley; data derived from Tradingview
USD/JPY
With the U.S. Dollar rally extending, USD/JPY has pushed back above the 150.00 level, which has been a challenging spot for bulls over the past two years as there’ve been two separate 1,000+ pip reversals taking place from that area.

USD/JPY Weekly Price Chart
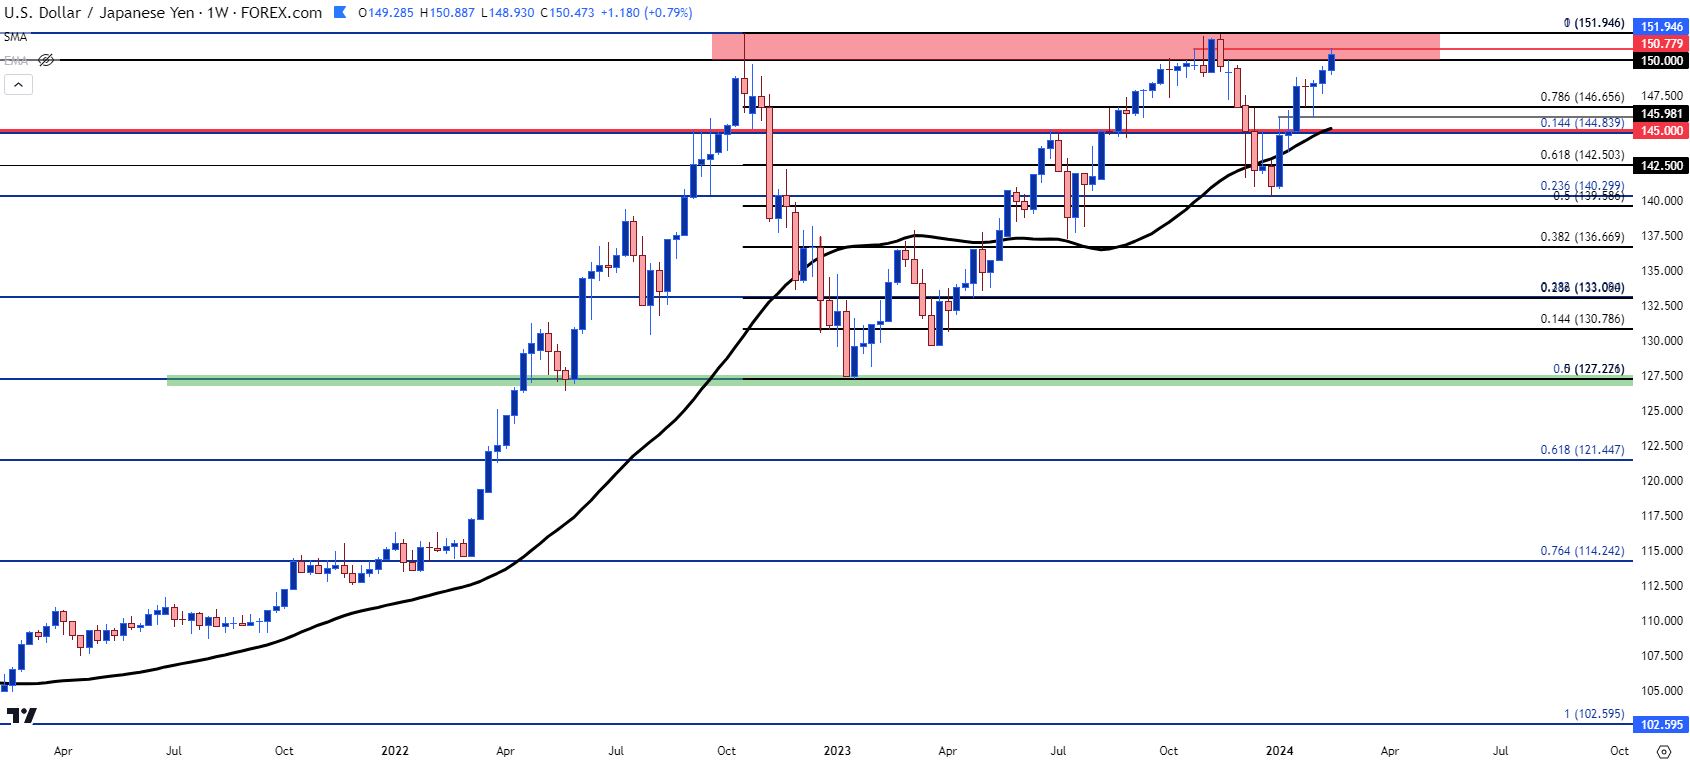 Chart prepared by James Stanley, USD/JPY on Tradingview
The 152.00 level is the top-side of that zone and it’s remained untouched for the past couple of years. This is where the finance ministry has previously ordered an intervention, so, logically, there could be some expectation of resistance around that price.
But as touched on in the webinar those matters can be messy. If 152 is thought of as a major point of resistance then logically there are probably some stops sitting above that. Which means if price does poke above that level, triggering those stops, that could lead to an influx of demand as stops on shorts (order to buy to cover) could lead to a quick shot of demand, which could push the move even-higher. This is essentially the type of thing that took place in gold in early-December and it can lead to a reversal, such as we saw there. But – stops above that level are vulnerable as a stronger spike could wick through a stop before the reversal does set-in.
Crowded trades such as we can see with a prolonged carry trend can bring a lot of nuance into the matter and while picking tops is always challenge, there is an extra dose of difficulty given the mass positioning on one side of the pair.
USD/JPY Daily Price Chart
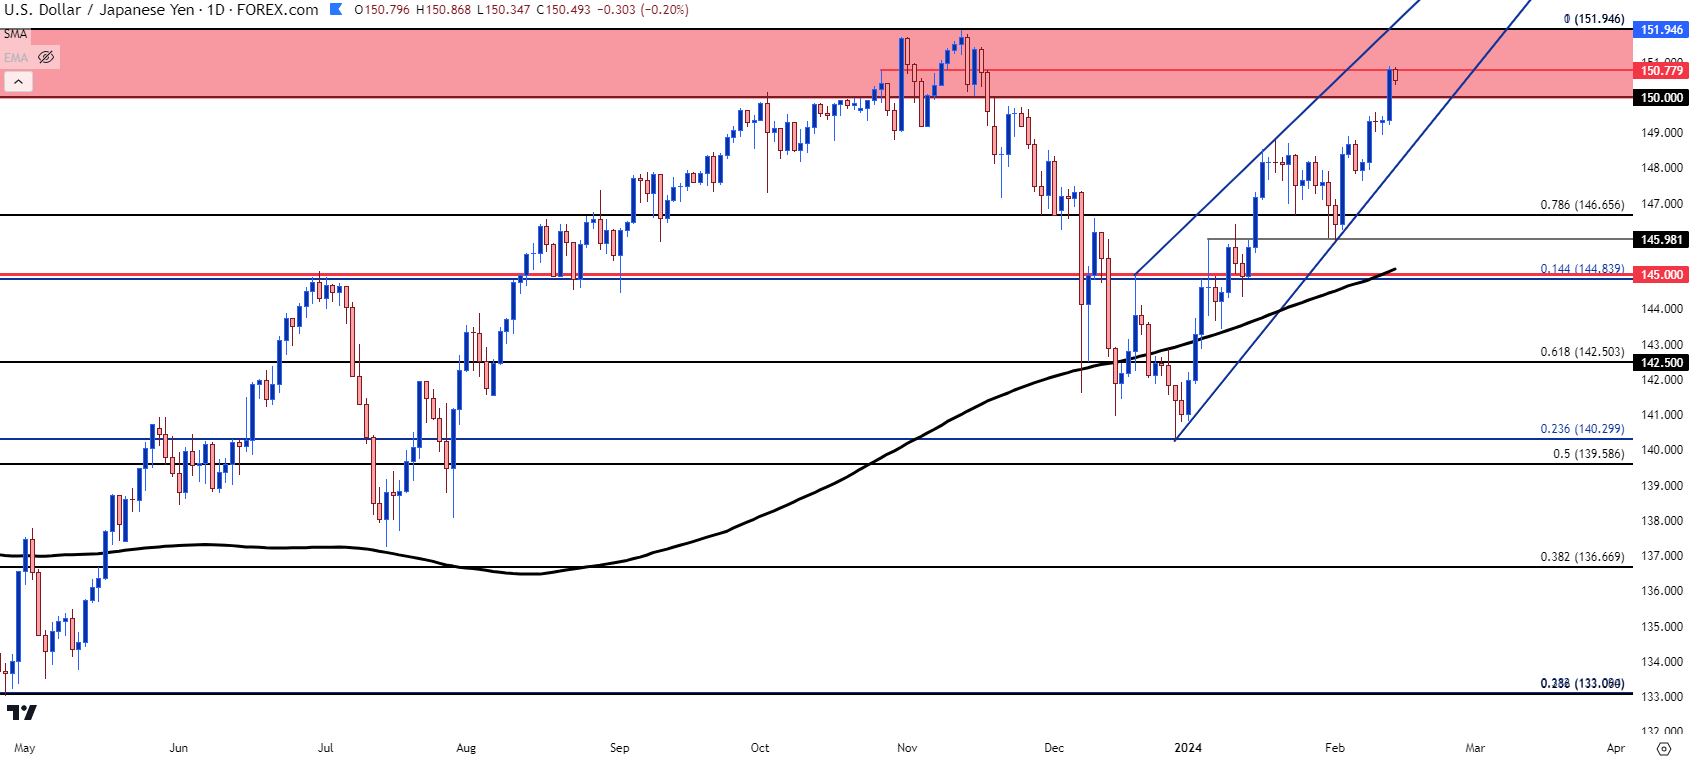 Chart prepared by James Stanley, USD/JPY on Tradingview
--- written by James Stanley, Senior Strategist
Latest market news
April 25, 2024 03:09 PM
April 25, 2024 03:00 PM
April 25, 2024 01:12 PM
Latest James Stanley articles

March 20, 2024 07:30 PM

March 16, 2024 02:00 AM

February 25, 2024 08:00 PM
February 17, 2024 02:00 AM