

Gold, XAU/USD talking points:
- Gold prices finally tested below the $2k psychological level and this was the first such instance in two months, since before the December FOMC rate decision.
- Bears had an open door to make a run, but USD resistance held at 105 on DXY, and that brought gold bulls back into the picture helping spot XAU/USD to push back above the psychological level.
- Even though U.S. data has remained strong, the Fed has remained dovish and this likely has to do with worries around China, Germany and a Japan that just went back into recession this week. If the Fed were hawkish that could drive intense capital flows into the U.S. which could create a problem for later in the year.
- I’ll be discussing these themes in-depth in the weekly webinar. It’s free for all to register: Click here to register.

It’s been a strong showing for gold bulls so far this year on a relative basis. Sure, price has continued to range around the $2k psychological level but given the bullish trend that’s built in the U.S. Dollar, one might’ve expected a larger drawdown in gold prices.
Until this week the $2k level had remained unfettered so far in 2024 trade but that streak finally ended on Tuesday after another above-expectation CPI release. That further illustrated the strength that’s shown in the U.S. economy, similar to the earlier-month NFP report. But, as has been the norm, this strength was met with a degree of skepticism from Fed officials in media engagements afterwards, such as the comment from Chicago Fed President, Austan Goolsbee, saying that market participants should avoid getting ‘flipped out’ over a single data point.
That helped to further the pullback in the USD, which helped to lift risk markets such as stocks and gold with spot XAU/USD re-taking the $2k level shortly after.
And this perhaps speaks to the very reason that gold was unable to test below that level before; as the strength in U.S. economic data has appeared to be shrugged off by Fed members so far this year. In gold, that comment came in right around the lows of the week, with the 10AM two-hour bar finishing as a bullish outside and a bullish engulf pattern. That ushered bulls back into the picture for the remainder of the week.
Gold Two-Hour Price Chart
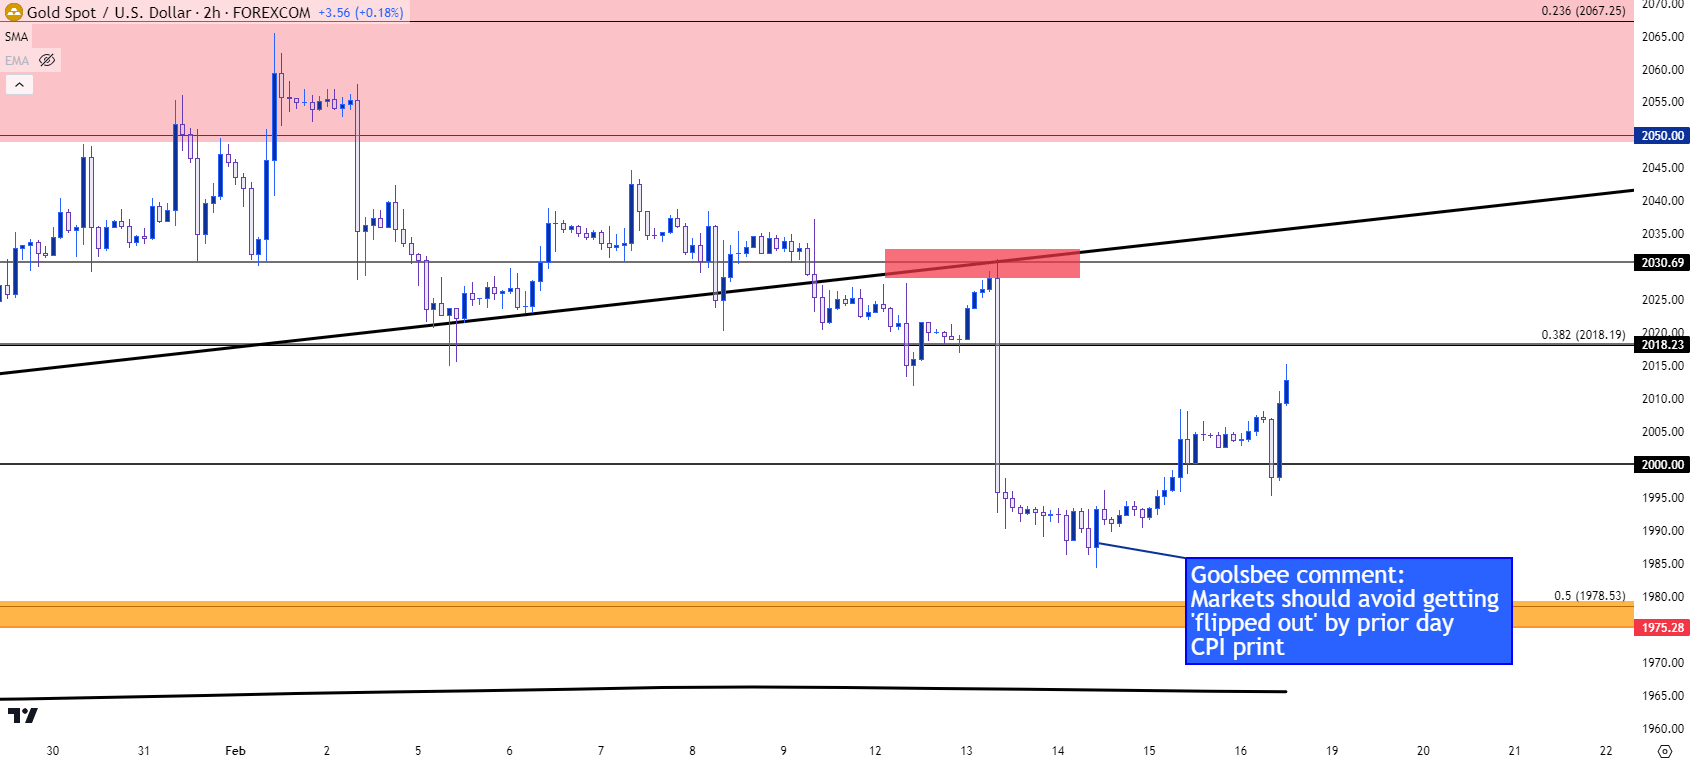 Chart prepared by James Stanley, Gold on Tradingview
While Fed drive appears to remain fairly dovish, all factors considered, there’s still some work to do on the technical front for bulls before they can get back in the driver’s seat for trends.
The Tuesday pullback showed resistance at a key area around the underside of a previously bullish trendline and that resistance is confluent with a prior support swing around the 2031 level. Before that comes into play, there’s the 38.2% retracement from the recent bullish move at 2018, and that’s a level that’s also exhibited some support so far this year. And above that is a longer-term zone of resistance that runs from 2050-2082 and I’ve talked about that on a few different occasions, and I’ll touch on it again after this next chart.
Gold Daily Price Chart
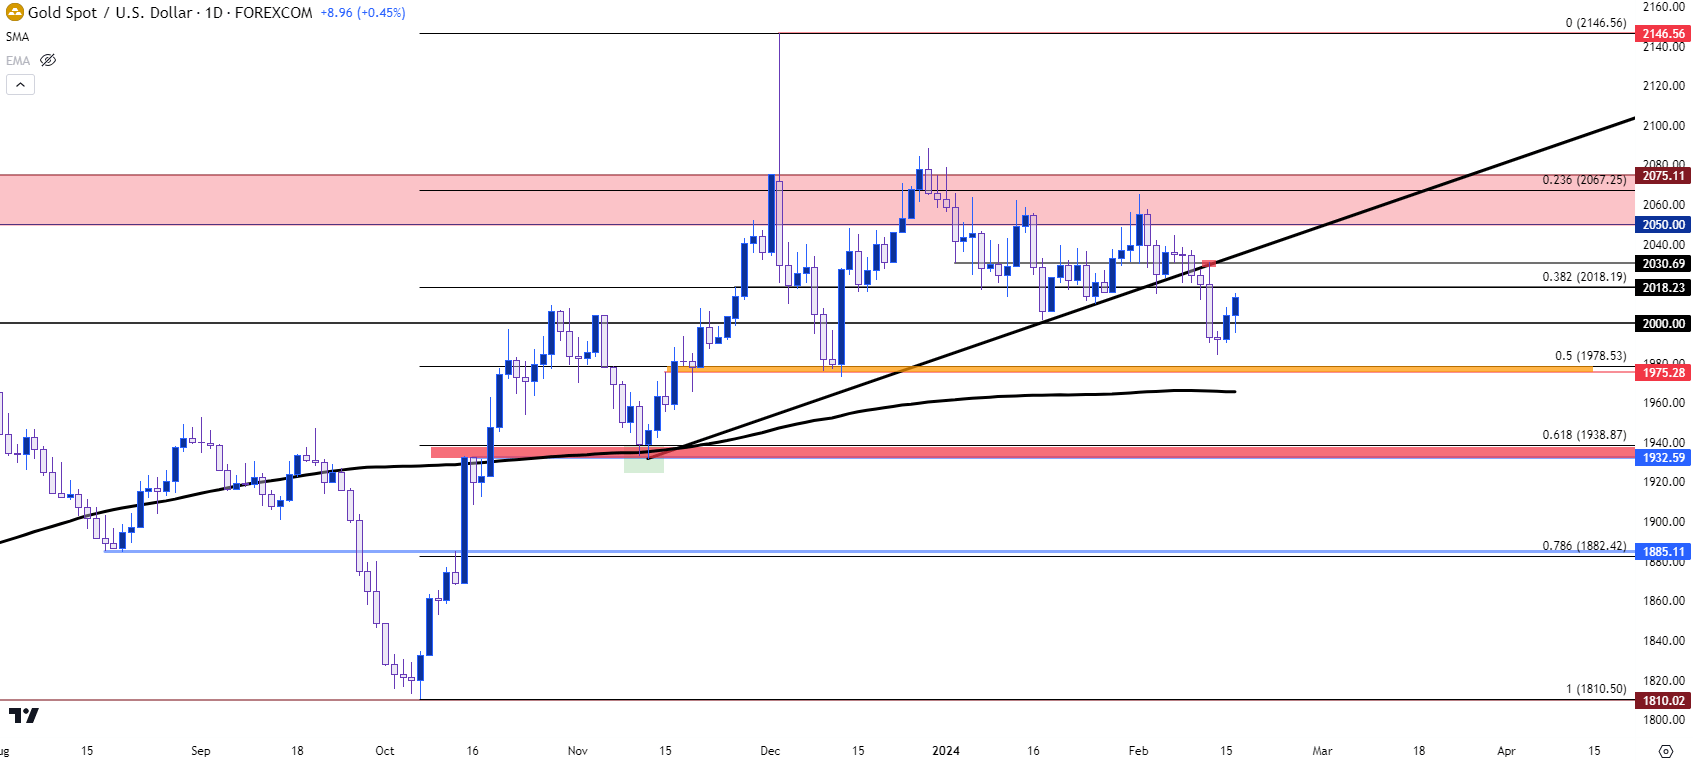 Chart prepared by James Stanley, Gold on Tradingview
Fed Remains Dovish – is that the Flip?
I’ve been saying that I think gold has the potential to build bullish trends above the $2k level, but only after the Fed formally flips into rate cuts. And given how dovish the Fed has been even in light of strong U.S. data, it may seem like that cut is somewhat inevitable and growing closer and closer.
Given the Fed’s continued passiveness even with continued U.S. economic strength, one might fear that they’re nearing the same mistake they made with ‘transitory,’ when they kept stimulus and low rates even as inflation pushed beyond 6 or 7%. But, likely, there’s a reason behind the Fed’s dovishness at this point, and it may just be the worry in the global backdrop.
The Chinese economy has faced challenges, and there’s significant worry around Germany. Japan went back into recession last week and there’s just not many other places for investors to seek safe harbors. If the Fed were to stick out from the global fray with a hawkish outlook and the warning of rate hikes, that could drive significant capital flows into the USD. And while that might sound like a ‘great thing’ for the U.S. economy, there’s reverberations to consider much as we saw during the prolonged run of USD-strength in 2021 and 2022 and then again for about three months last year.
That’s generally the type of backdrop that can build favor for gold and, again, that’s likely a reason for gold’s ability to hold above $2k so far this year even as a bullish trend developed in the USD.
The big question at this point is when cuts might actually begin. From the weekly chart below we can see gold continuing to hold very near the multi-year resistance around $2,050-$2,082. Bears took their shot at filling in the other side of that range this week but have so far been soundly re-buffed. The question for price action at this point is whether bulls can find a more favorable outcome on tests of those familiar resistance levels of $2,032 and then $2,050.
Gold Weekly Price Chart
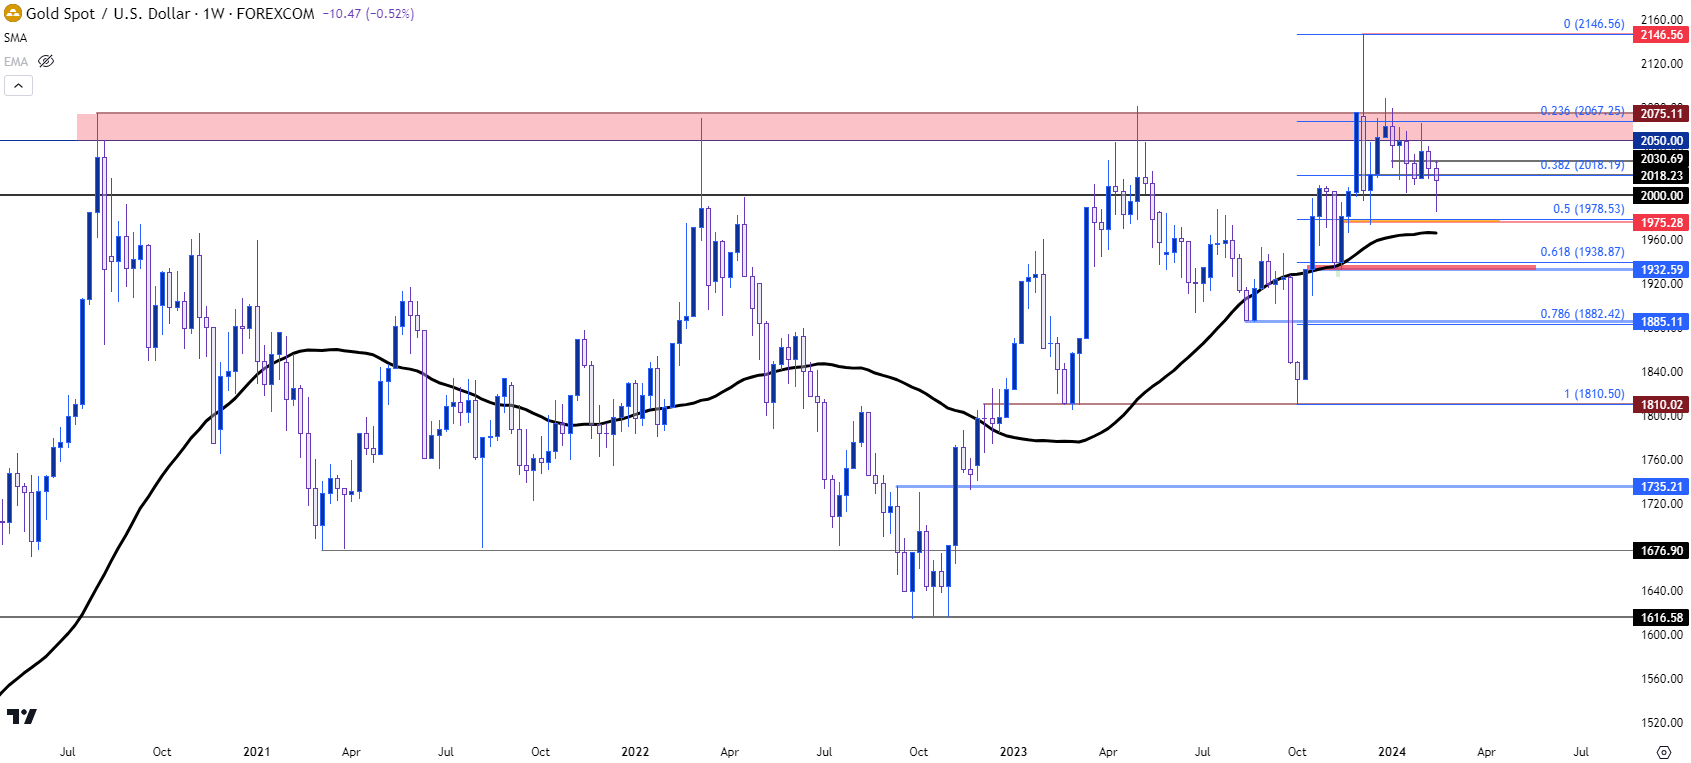 Chart prepared by James Stanley, Gold on Tradingview
--- written by James Stanley, Senior Strategist
Latest market news
Yesterday 01:32 PM
Yesterday 09:35 AM
Yesterday 07:23 AM
Yesterday 04:48 AM
Yesterday 12:17 AM
July 25, 2024 10:39 PM
Latest Trade Ideas articles

Yesterday 09:35 AM

Yesterday 12:17 AM

July 25, 2024 10:39 PM

July 25, 2024 05:30 PM