September 21, 2022 3:33 PM

Source: Tradingview, Stone X
As a result of an expected hawkish FOMC today, combined with Putin’s comments regarding the call of 300,000 reservists, the DXY has moved higher and EUR/USD has moved lower. The DXY reached its highest level in 20 years. However, be wary of a “Buy the rumor, sell the fact” trade in the US Dollar after the Fed’s decision later today.
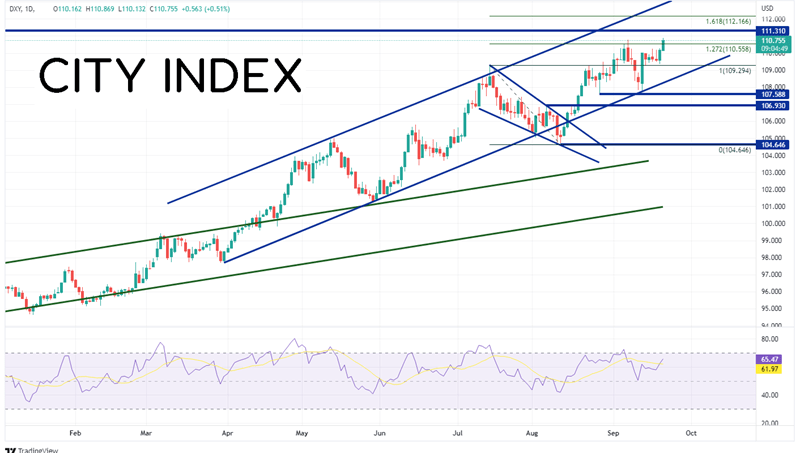
The US Dollar Index (DXY) reached its highest level in over 20 years today rising to an intra-day high of 110.87, eclipsing the September 7th highs of 110.79. With the FOMC meeting concluding today, the central bank is expected to hike rates by 75bps, to bring the Fed Funds rate to 3.25%. This would be the third consecutive 75bps hike if the Fed hikes as expected. See our complete FOMC preview here. Just as important is the “dot plot”, which tells us how high the Fed thinks interest rates may go. In June, the median dot plot showed rates at year end at 3.375%. This will likely be lifted substantially at today’s meeting. The high rate expectations are helping the US Dollar to remain bid today.
Everything you need to know about the Federal Reserve
In addition, Russia’s Putin said that he was mobilizing 300,000 reserves to help annex parts of Ukraine, in particular, the Donbass region. As a result, the “flight to safety” trade was on. Traders sold Euros and other risky assets and bought Yen and the US Dollar. This also contributed to a higher US Dollar.
As mentioned, the US Dollar Index (DXY) reached a new 20 year high today, as the index traded above the September 7th highs of 110.79. However, the DXY has been in an uptrend since May 2021, becoming more aggressive in April 2022 as price broke above the top line of the green ascending channel near 100.00. If the DXY continues to move higher, the next horizontal resistance is at 111.31, which is resistance from August 2001. Above there, price can trade to the 161.8% Fibonacci extension from the highs of July 14th to the lows of August 11th, near 112.16, then the top trendline of the upward sloping channel near 112.80. However, if the DXY is in a “buy the rumor, sell the fact” mode after the FOMC decision, first support is at yesterday’s low of 109.36, then the bottom trendline of the channel near 108.30. Below there, the next support level is the lows from September 13th at 107.68.
Source: Tradingview, Stone X
Trade the DXY now: Login or Open a new account!
• Open an account in the UK
• Open an account in Australia
• Open an account in Singapore
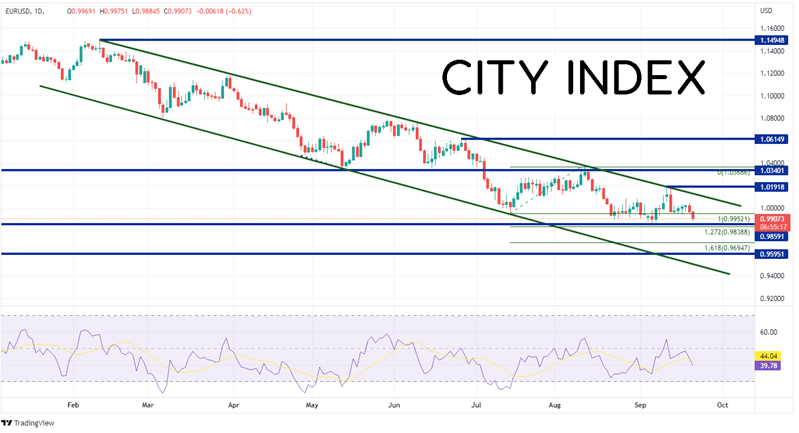
As EUR/USD sold off after the Putin speech, the pair is threatening to make trade to its lowest level since December 2002. First support is the low from December 6th at 0.9864. Just below there is the 127.2% Fibonacci extension from the lows of July 14th to the highs of August 11th at 0.9839, then the 161.8% Fibonacci extension from the same timeframe at 0.9695. However, if EUR/USD bounces, the first resistance level is at yesterday’s high of 1.0051, then the top downward sloping trendline of a long-term channel near 1.0131. Above there, the EUR/USD can move to the highs from September 12th at 1.0198.
Source: Tradingview, Stone X
Trade EUR/USD now: Login or Open a new account!
• Open an account in the UK
• Open an account in Australia
• Open an account in Singapore
As a result of an expected hawkish FOMC today, combined with Putin’s comments regarding the call of 300,000 reservists, the DXY has moved higher and EUR/USD has moved lower. The DXY reached its highest level in 20 years. However, be wary of a “Buy the rumor, sell the fact” trade in the US Dollar after the Fed’s decision later today.
Learn more about forex trading opportunities.
Latest market news
Yesterday 01:32 PM
Yesterday 09:35 AM
Yesterday 07:23 AM
Yesterday 04:48 AM
Yesterday 12:17 AM
July 25, 2024 10:39 PM
Latest Forex articles

Yesterday 12:17 AM

July 25, 2024 10:39 PM

July 25, 2024 03:59 PM

July 25, 2024 04:37 AM