

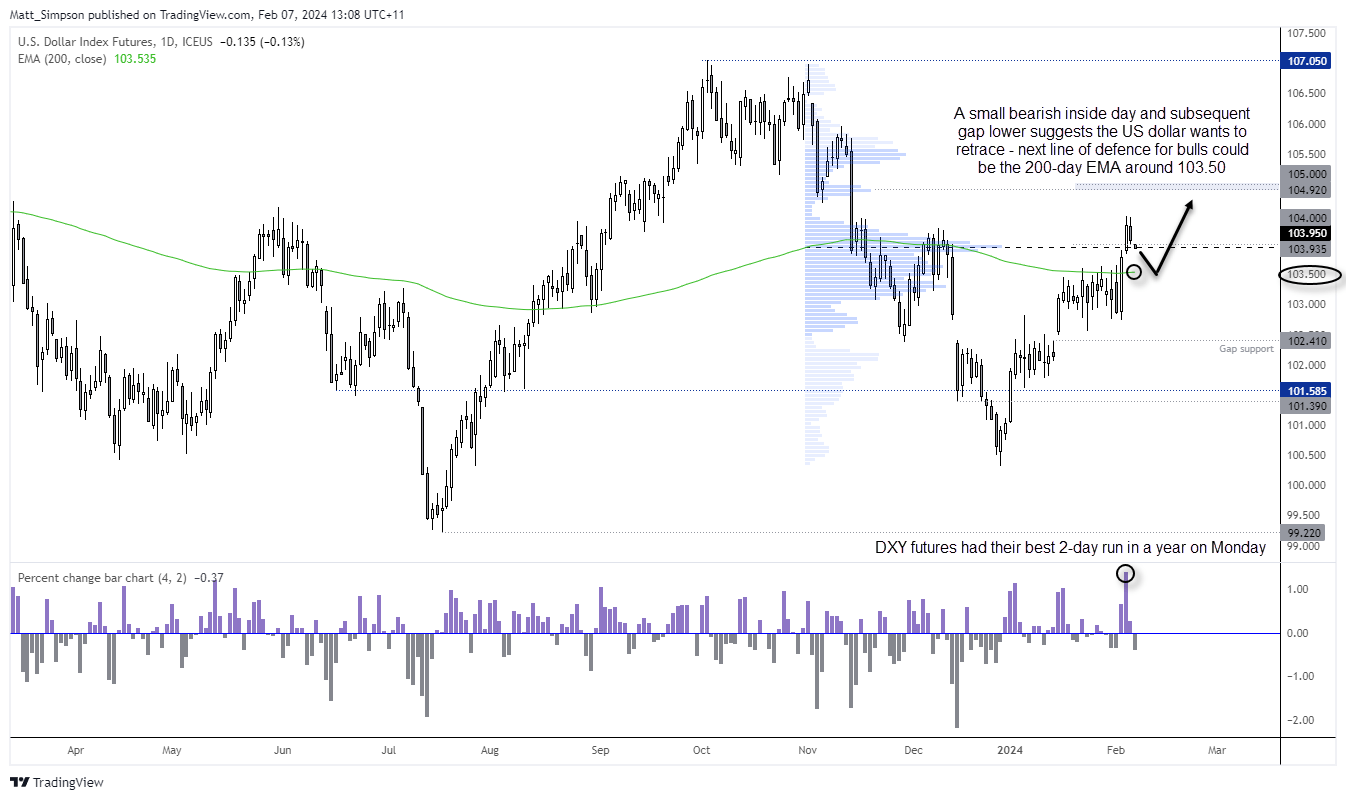
US dollar index technical analysis (daily chart):
The US dollar index enjoyed its best 2-day rally between Friday and Monday thanks to the strong NFP figures and inflationary ISM services report. So it can be excused for being the weakest FX major on Tuesday, as it simply looks like a retracement against that two-day bullish move.
The small bearish inside day around the cycle high and subsequent gap lower today suggests the US dollar index wants to retrace further. But let us not lose sight of the fact that the US dollar index retains a bullish daily structure, and any pullback towards its 200-day EMA (103.50) is likely to be viewed favourably by bulls.
Even if it flirts with a break beneath the 200-day EMA, I suspect the elongated bullish engulfing candle is going to be tough to break beneath. So unless the Fed turn on their dovish mode, bears may look to enjoy a retracement lower for USD on the intraday timeframes until momentum reverts to the bullish daily trend.
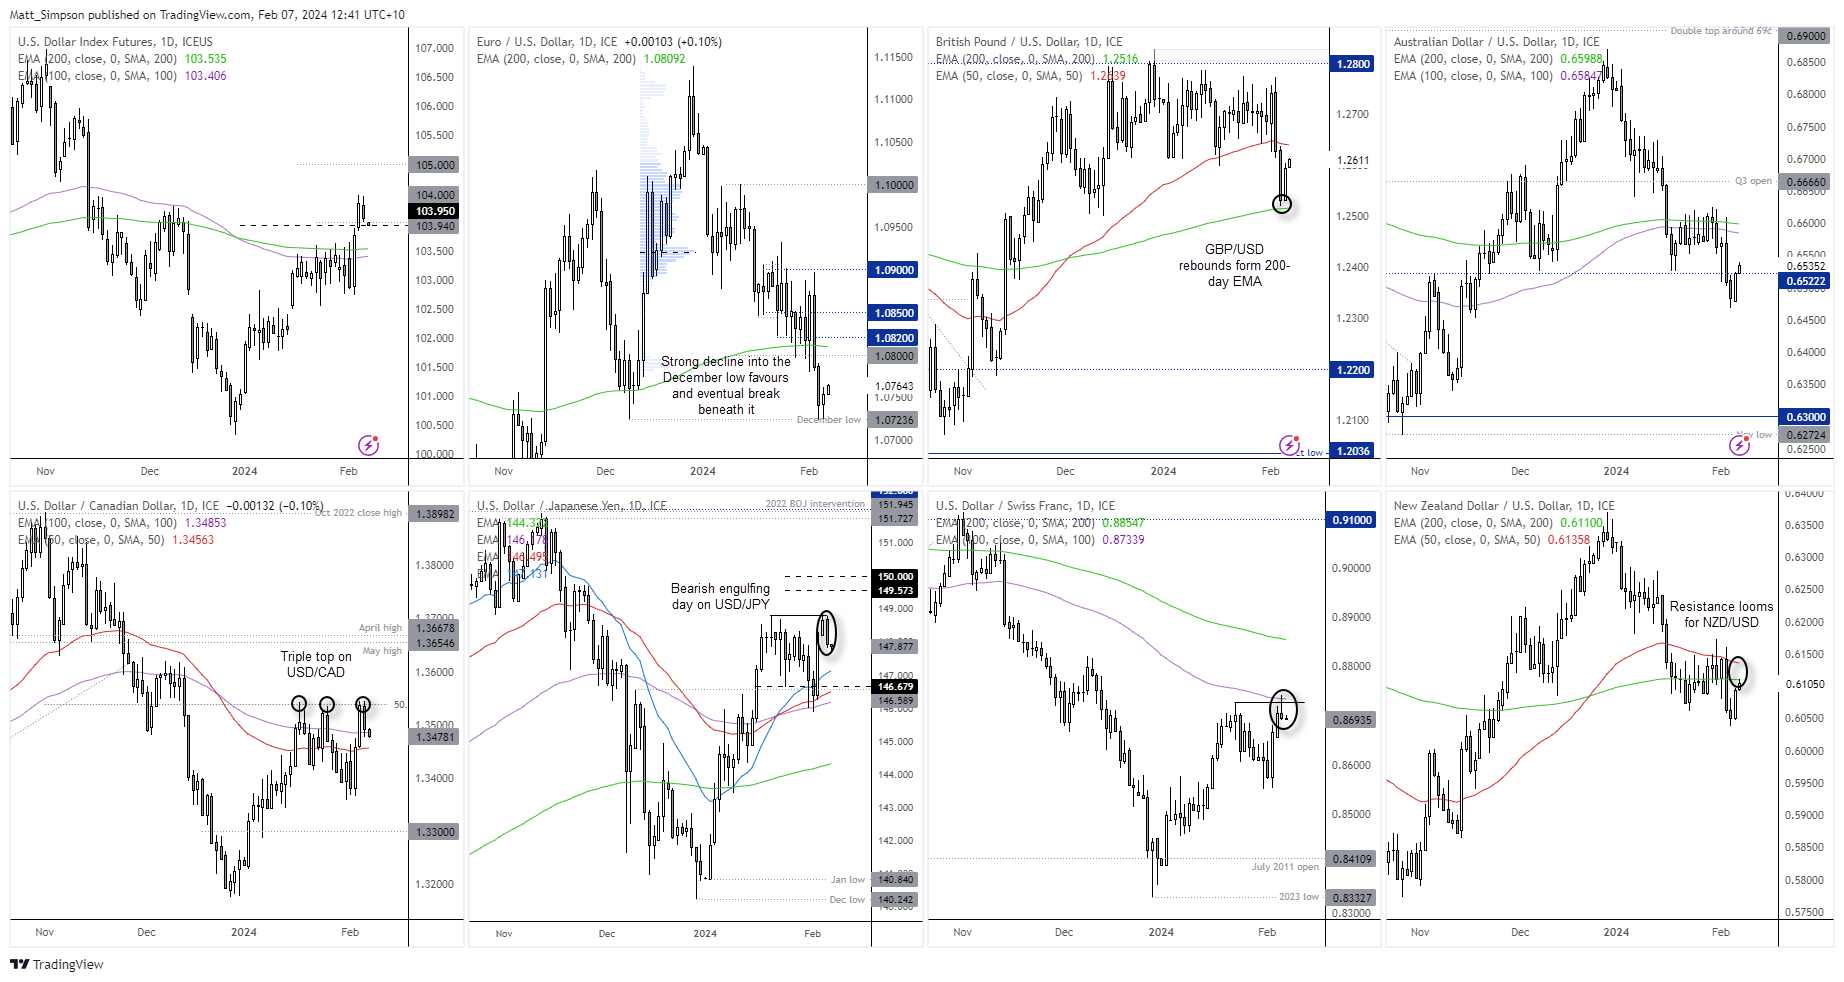
Forex majors overview (daily chart):
We’re not in a phase where forex majors are dominated by the USD by equal degrees. And that is to be expected during a corrective phase which lacks a macro catalyst. And without top-tier data to drive the US dollar, FX major pairs are playing nicely with technical levels.
- GBP/USD has rallied from its 200-day EMA after breaking down from its 1.26 – 1.28 range, and now flirting with a break of its old support level around 1.26.
- USD/CHF printed a 1-day bearish reversal candle (shooting star) at its 100-day EMA after it failed to hold onto its breakout above the January high – perhaps there’s room for a deeper pullback
- AUD/UD and NZD/NZD are trying to extend their gains for a second day with minimal effort. Yet NZD/USD is staling around 0.6100 and its 200-day EMA whilst AUD/USD is struggling to tap the 0.6650 level or 10-day EMA
- A bearish engulfing day formed on USD/JPY, but already in Wednesday’s Asian session is lacks enthusiasm to drop materially lower
- USD/CAD formed a tripled top on the daily chart around a 50% retracement level, but is trying to fund support around its 100 and 200-day EMAs
- EUR/USD has heled above its December low, but given the magnitude of the drop to that key support level an eventual break beneath it is currently favoured
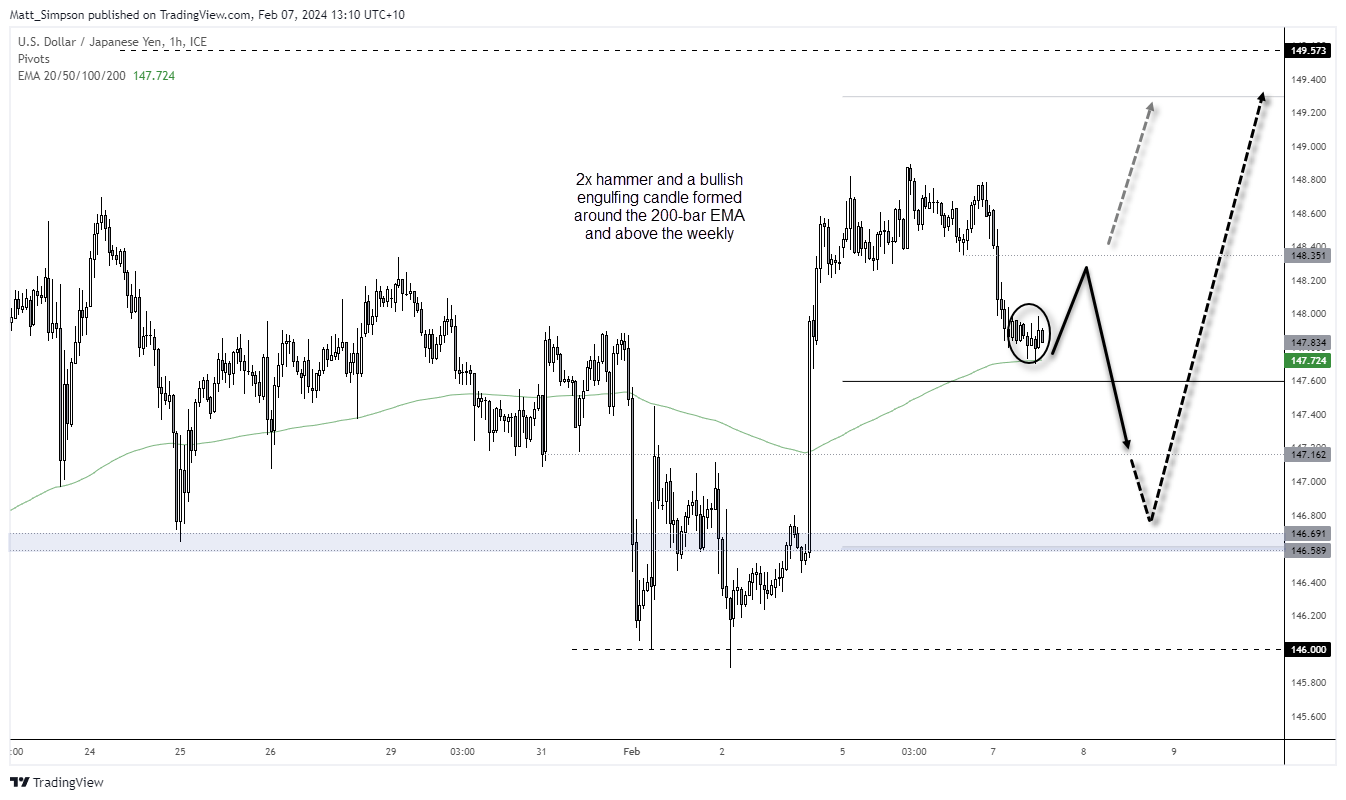
USD/JPY technical analysis (1-hour chart):
The bias for a move to 150 remains in place, although yesterday’s bearish engulfing candle warns of a pullback. The 1-hour chart shows that USD/JPY has found support above its weekly pivot point and at its 200-bar EMA. Given the two small bullish hammers and bullish engulfing candle, a sing low may have formed.
Bulls could seek dips within the last 3-hour range in anticipation of a break above 148, and potential move for 148.20 and 148.35.
Due to the potential for the US dollar to retrace further, another leg lower also remains a possibility. At which point, I would seek bullish setups if evidence of support appears around 147.20 or 146.60 – 146.80.
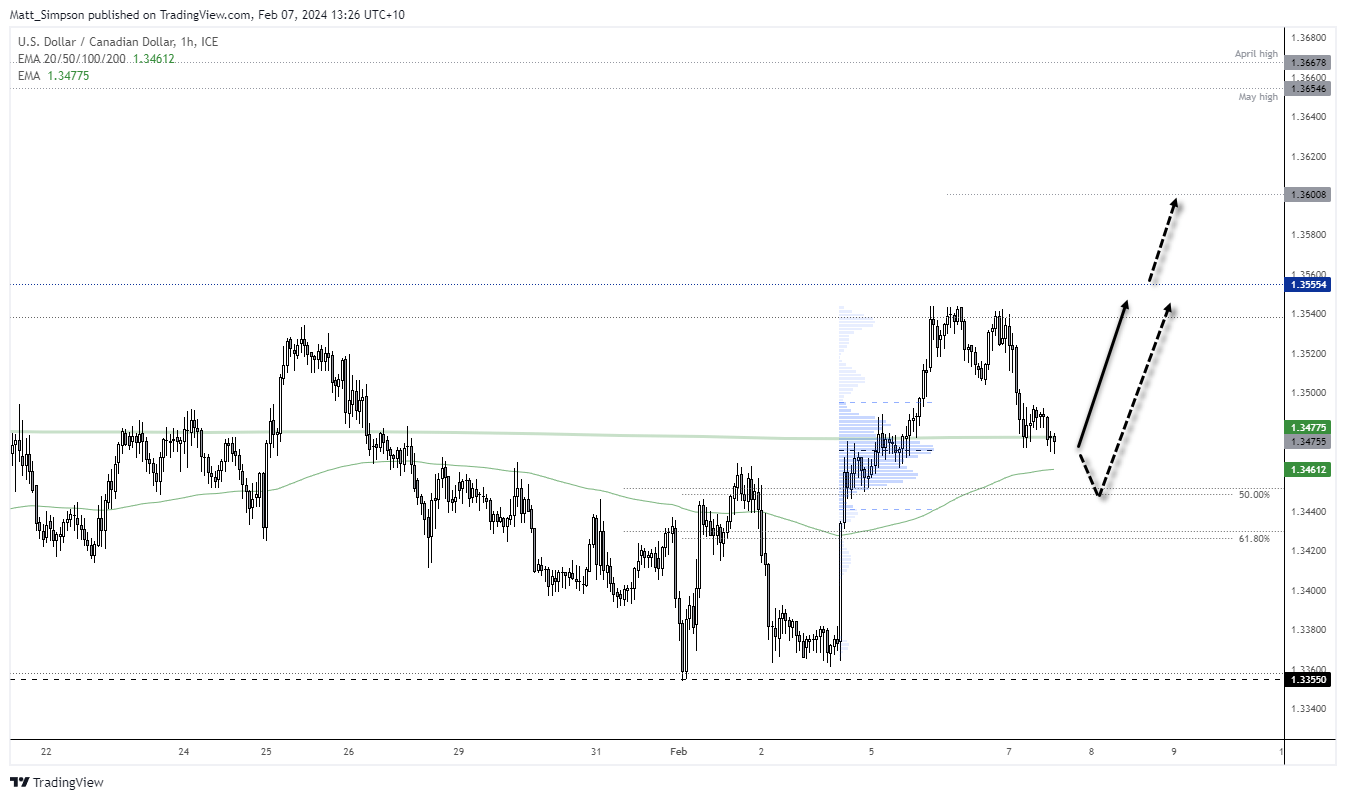
USD/CAD technical analysis (1-hour chart):
The BOC was the latest central bank to push back on cutting rates too soon, which helped the Canadian dollar catch a bid against the US dollar. As noted on the daily chart, a tripled top occurred at a 50% level, and previous analysis has also noted CAD’s tendency to react around 50% retracement levels. And that could come in handy now.
Prices are trying to hold above the 200-day EMA around a volume cluster, but if prices retrace further then bulls could seek to enter around 1.3450 / 50% retracement level for a swing trade long. And as I suspect then current move lower is corrective, perhaps it can also break above the triple top and its way to the original 1.36 target.
-- Written by Matt Simpson
Follow Matt on Twitter @cLeverEdge
How to trade with City Index
You can trade with City Index by following these four easy steps:
-
Open an account, or log in if you’re already a customer
• Open an account in the UK
• Open an account in Australia
• Open an account in Singapore
- Search for the market you want to trade in our award-winning platform
- Choose your position and size, and your stop and limit levels
- Place the trade
Latest market news
Yesterday 01:39 PM
Yesterday 01:29 PM
Yesterday 12:16 PM
Latest Trade Ideas articles


Yesterday 12:16 PM