


March 8, 2022 4:35 PM
The US will release CPI data for February on Thursday. Expectations are once again for a high reading. This month economists are looking for a 7.9% YoY reading vs a 7.5% YoY print in January. The Core CPI print, which excludes the volatile for and energy components, is expected to be 6.4% YoY vs a reading of 6% YoY in January. Much of the world had been seeing inflation rise for the last year due to supply constraint issues and rising wages. However, now they are also seeing a rise in inflation due to higher commodity prices because of the Russia/Ukraine conflict. This increase in prices will, most likely, eventually be passed through to consumers. It’s important to note that the price of Crude oil for February traded from 88.15 on February 1st and closed the month at only 95.72. Therefore, the run up in oil prices since March 1st to 127.50 will not be included in the CPI print.
Higher US inflation means a stronger US Dollar. (See “The US Dollar Index (DXY): How much higher can it go?”) In addition, higher inflation also means traders will be searching for somewhere to park their money as the Fed raises rates and risk moves lower. That place is usually precious metals, especially Gold.
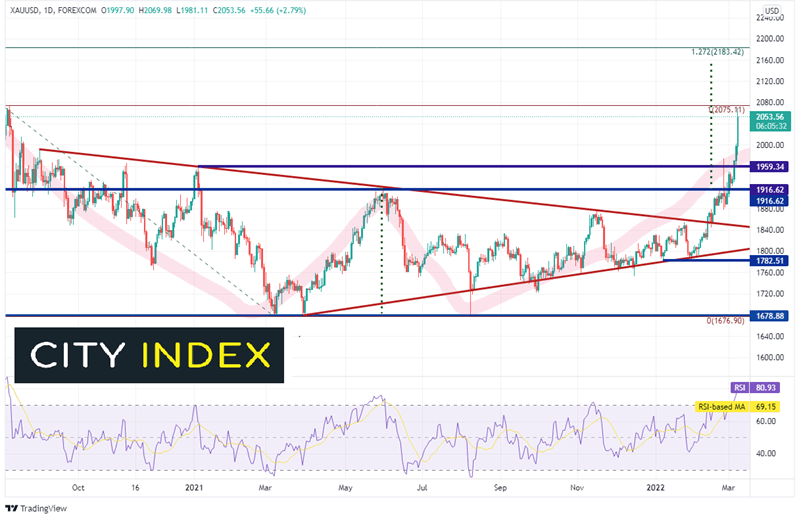
Gold (XAU/USD) had been trading in as symmetrical triangle since making all-time highs in August 2020. After making a double bottom in the summer of 2021 near 1678.88, the precious metal began moving higher and broke above the top trendline of the triangle on February 11th, the day the US announced that Russia could invade Ukraine at any time. In late February, Gold broke through the neckline of the double bottom and was off to the races. The target for double bottom is near 2153, however first the pair must get through the all-time highs of 2075. However, notice that the RSI on the daily timeframe is in overbought conditions, an indication that Gold may be ready for a pullback.
Source: Tradingview, Stone X
Trade Gold now: Login or Open a new account!
• Open an account in the UK
• Open an account in Australia
• Open an account in Singapore
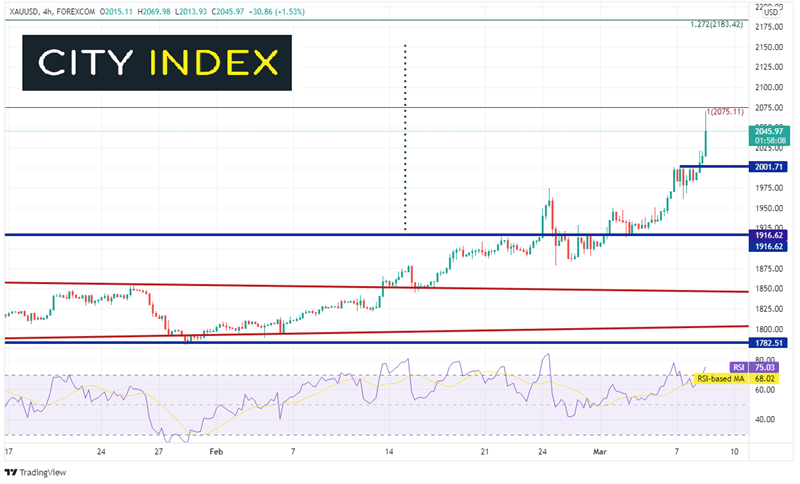
On a 240-minute timeframe, the latest 4-hour bar has had quite a range! , trading from a low of 2013 to a high of 2069.98. First resistance is at the all-time highs of 2075.11. Above there, gold can move to the double bottom target at 2153 and then the 127.2% Fibonacci extension from the highs of August 2020 to the double bottom lows in the summer of 2021, near 2183.42. Horizontal support sits at 2001.71, then 1950.27. If Gold falls below there, if can drop quickly to the neckline of the double bottom near 1916.62.
Source: Tradingview, Stone X
February’s CPI print is expected to be strong. The risk is that it comes in weaker. If the number is soft, we could see Gold move lower in a hurry.
Learn more about metals trading opportunities.
Latest market news
Yesterday 03:00 PM
Yesterday 01:12 PM
Yesterday 11:14 AM
Latest Trade Ideas articles
Yesterday 03:00 PM
Yesterday 11:14 AM
April 24, 2024 11:00 AM