January 3, 2022 8:44 PM

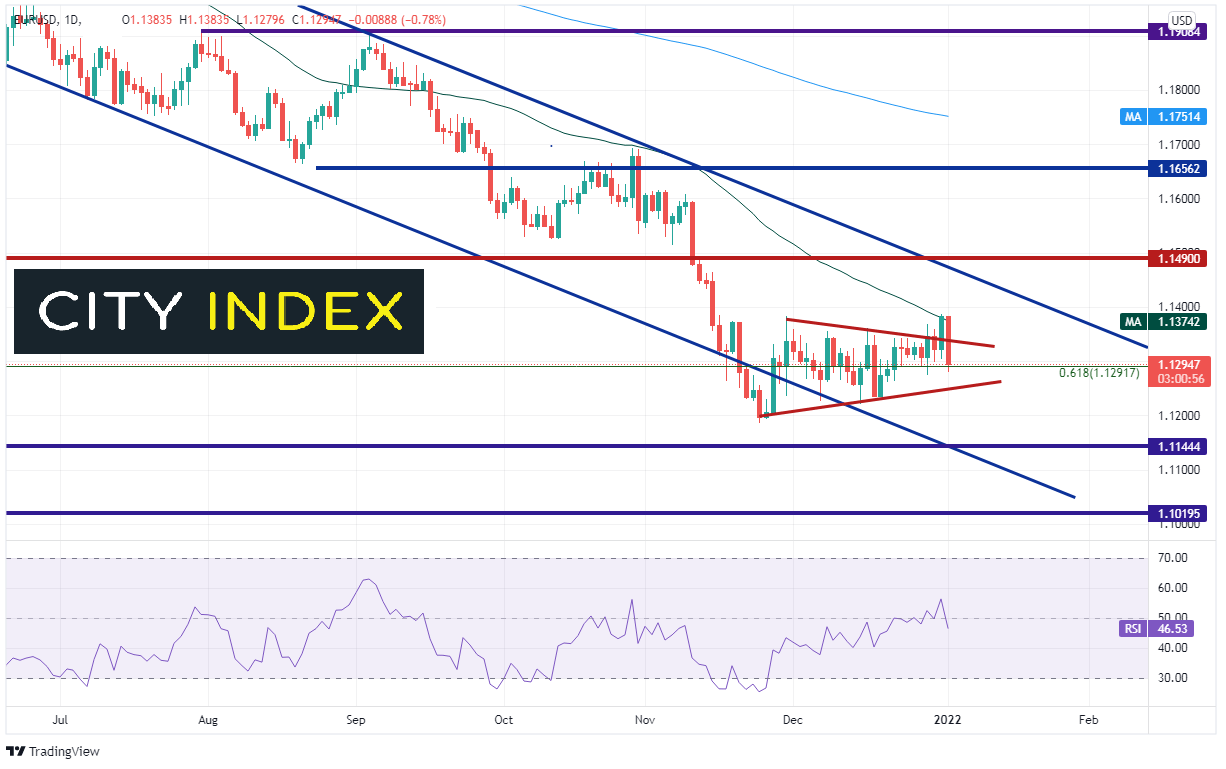
As my colleague Matt Weller wrote about earlier, the US Dollar crushed it on the first trading day of the new year. The DXY moved from a low of 95.65 (just above the 50 Day Moving Average at 95.57) to a high of 96.32! The index moved back inside a symmetrical triangle, posting a false breakdown near the 50% retracement from the highs of March 2020 to the lows of January 2021. With the aggressive move higher in the DXY, comes a similar, but opposite move in EUR/USD, as the pair fell over 100 pips and formed a bearish engulfing candle!
Source: Tradingview, Stone X
Trade EUR/USD now: Login or Open a new account!
• Open an account in the UK
• Open an account in Australia
• Open an account in Singapore
The Euro makes up 58% of the DXY, so it makes sense that a solid move higher in the DXY would have an inverse affect on the Euro. But its not only technical. With the Fed moving forward the timeframe for the end of its bond purchasing program by 3 months to March, the Fed will be ending while the ECB is extending. Although the ECB will be ending its PEPP purchase program, it will still be purchasing bonds through its restructured APP program until the committee deems its feasible to stop. This is now a case of a hawkish Fed vs a dovish ECB.
Central Banks: Liftoff in Focus?
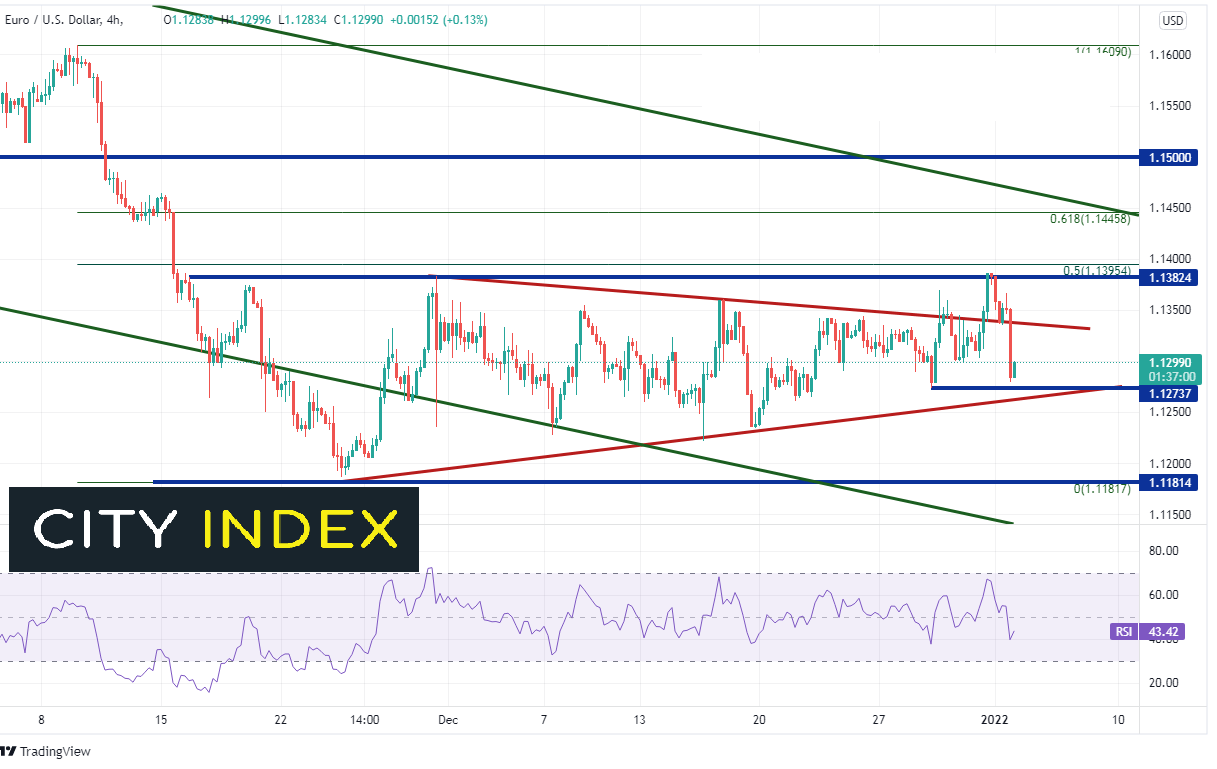
On a 240-minute timeframe, after reaching a low on November 24th, 2021 near 1.1182, EUR/USD bounced to the 50% retracement level from the highs of November 9th, 2021 to the lows on November 24th, 2021, near 1.1383. The pair has since been creating higher lows and lower highs, forming a symmetrical triangle. On Friday, EUR/USD posted a false breakout and tested the prior resistance November 24th highs. However, with the strong move in the US Dollar, EUR/USD pulled back into the triangle and tested the lows from December 29th, near 1.1274. Resistance is now at a confluence of Monday’s highs near 1.1386 and the previously mentioned 50% retracement level at 1.1395. The 61.8% Fibonacci retracement level from the same time frame above there is at 1.1446 and then the top downward sloping trendline of the long-term channel near 1.1465. If EUR/USD breaks below 1.1274, the bottom trendline of the triangle is very close at 1.1260. Below there, price can fall all the way to the lows of November 24th, 2021 at 1.1182, then the bottom downward sloping trendline of the channel near 1.1140.
Source: Tradingview, Stone X
Learn more about forex trading opportunities.
Latest market news
Yesterday 01:32 PM
Yesterday 09:35 AM
Yesterday 07:23 AM
Yesterday 04:48 AM
Yesterday 12:17 AM
July 25, 2024 10:39 PM
Latest Forex articles

Yesterday 12:17 AM

July 25, 2024 10:39 PM

July 25, 2024 03:59 PM

July 25, 2024 04:37 AM