

The ASX 200 has risen around 1.7% at the time of writing after US indices rallied despite the stronger than expected inflation report from the US. Energy stocks have taken the lead with the sector rising 3.8% as they track oil prices higher, and all 11 ASX sectors have posted gains for the day so far. We can’t help but be a little suspicious of the rally, given it is likely fuelled by Wall Street’s short covering. But markets never move in a straight line and must move counter to their own trends once in a while, which leaves the potential for some further upside – at least over the near-term.
ASX 200 weekly chart:
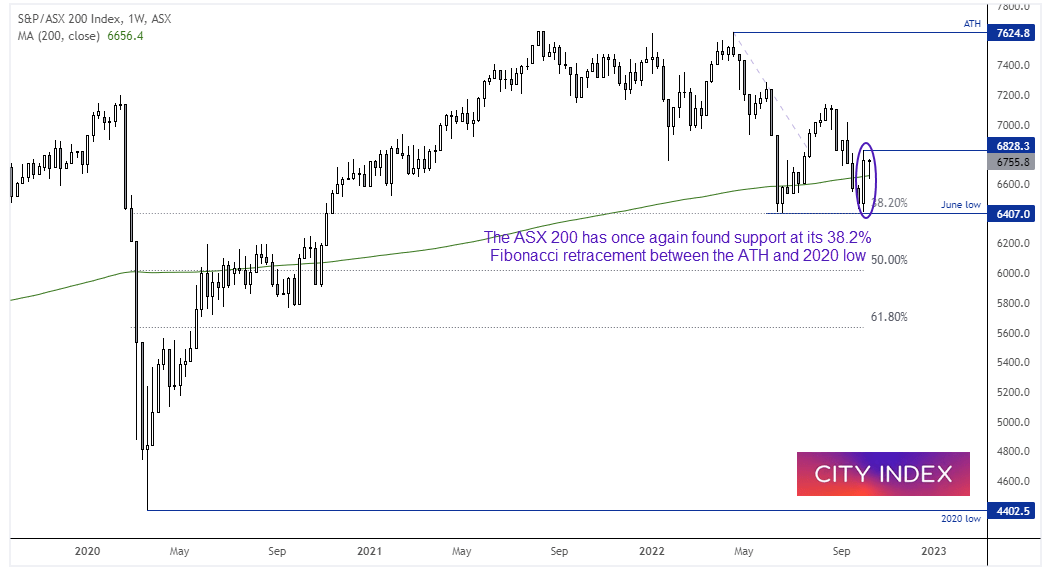
We can see on the weekly chart that ASX 200’s decline from 7324.8 ha once again found support at the 38.2% Fibonacci ratio between the 2020 low and ATH (al-time high). A bullish engulfing candle formed last week which closed above its 200-week MA, and that same MA provided support earlier this week. It was also one of the few major indices to hold above its June low (unlike Wall Street), which made it a prime candidate for a bounce should bearish sentiment east. The question now is whether it can break above the October high of 6828.3.
ASX trading volumes are on the ow side today (so far):
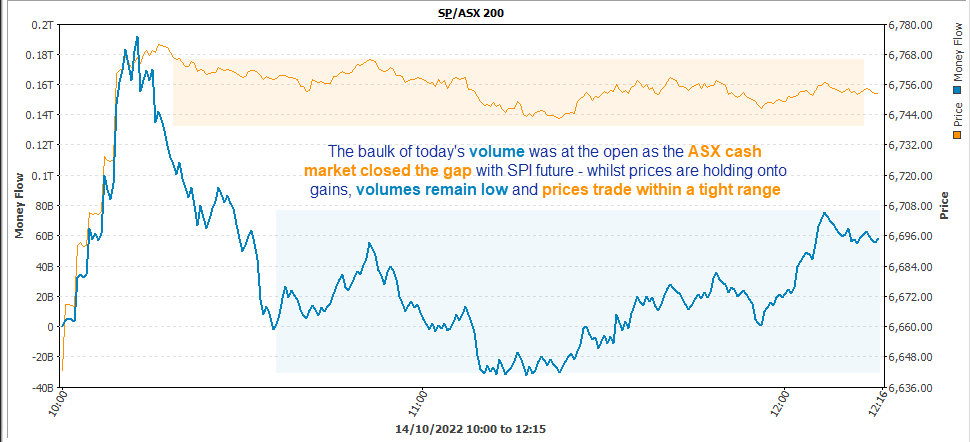
The baulk of the day’s volume has been in the first 15 minutes of trade, where the index leapt higher to close its gap with the SPI 200. Sure, it’s holding on to those gains – but at the same time buying has slowed to a trickle as the index trades within a tight range on relatively low volumes. I’m not betting on an imminent break of the October high just yet, especially when it seemingly down to traders ‘selling the rumour and buying the fact’ after another hotter-than-liked inflation print from the US.
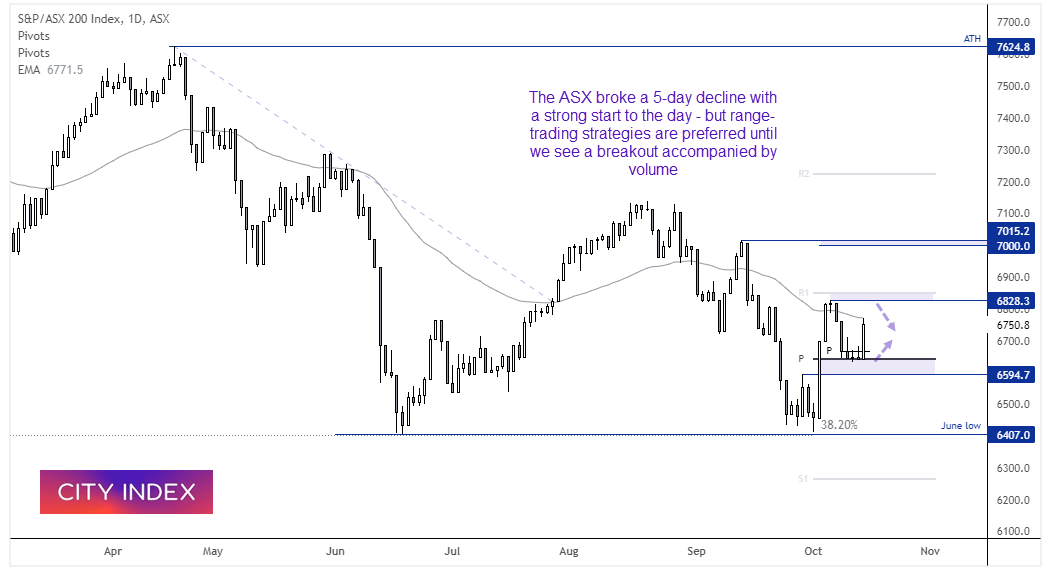
ASX 200 daily chart:
Support has been found around the weekly and monthly pivot points, although the 50-day EMA has capped as resistance today. Due to the lower trading volumes for today’s rally and the fact it has been driven by Wall Street’s short-covering rally, range-trading strategies are preferred between the approximate 6600 – 6530 range.
How to trade with City Index
You can easily trade with City Index by using these four easy steps:
-
Open an account, or log in if you’re already a customer
• Open an account in the UK
• Open an account in Australia
• Open an account in Singapore
- Search for the company you want to trade in our award-winning platform
- Choose your position and size, and your stop and limit levels
- Place the trade
Latest market news
Yesterday 01:32 PM
Yesterday 09:35 AM
Yesterday 07:23 AM
Yesterday 04:48 AM
Yesterday 12:17 AM
July 25, 2024 10:39 PM
Latest Trade Ideas articles

Yesterday 09:35 AM

Yesterday 12:17 AM

July 25, 2024 10:39 PM

July 25, 2024 05:30 PM