

It has been quite a choppy day so far in the stock markets, in what is the last week of the quarter and first half. There will be lots of fund managers rebalancing their portfolios this week, which could mean more volatility ahead in the next few days. There’s no conviction right now. Betting on a bear-market bottom could be a costly mistake, while selling short is not as lucrative as was the case when markets were higher. So, it is all about timing for both bulls and bears alike. While the S&P 500 swung between gains and losses, the tech-heavy Nasdaq 100 remained lower after an intraday bounce off the lows. Tech stocks and gold have underperformed today because of a rebound in Treasury yields, making non-interest-bearing or low-dividing stocks less appealing.
After a rise over 3% for the S&P 500 on Friday, the stock market bulls would have liked to see some follow-through today. Actually, the day started positively, and it looked like some further lost ground would be made up earlier. However, it was a downhill ever since the European open, until a late bounce into the European close. It remains to be seen whether the US will continue higher from here, although I have my doubts.
While some might find this sort of price action confounding, this is how a bear market should be: big short-covering bounces, followed by renewed weakness on no news.
As mentioned in my earlier report, stocks, bonds and some foreign currencies have been able to recover a little of late, with some attributing the moves to expectations that as recession fears intensify, this will only fuel bets on eventual rate cuts from the Fed earlier. Overthinking about what might happen, it is clear that some traders lost sight of what’s in front of them right now: Hawkish Fed, rate hikes around the world and growth-chocking inflation everywhere. This is why we haven’t seen any follow-through today.
I reckon investors will unfortunately be hit with further hawkish surprises down the line, which will keep the 'growth fears' and 'inflation anxiety' trades alive for a long time.
So, I think the start of another equity and bond market sell-off is nigh.
Interestingly, the S&P 500 has now created an inverted hammer on the daily chart off the falling 21-day exponential moving average.
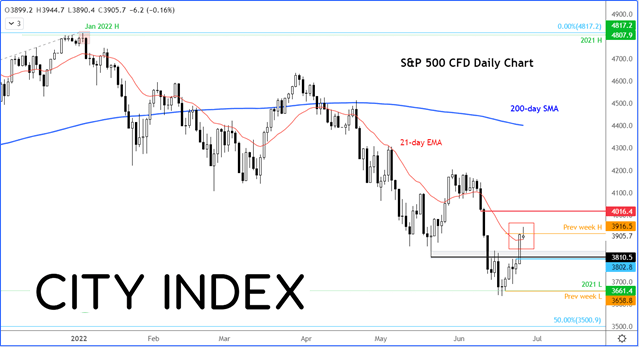
This is a classic example of price action in a downward-trending market. You get a few days of relief, then a sharp rejection as the sellers step back in while dip buyers take quick profits amid fears the gains will not hold.
If a reversal stick is formed here, then a drop to the next support at 3810 would become highly likely.
How to trade with City Index
You can trade with City Index by following these four easy steps:
-
Open an account, or log in if you’re already a customer
• Open an account in the UK
• Open an account in Australia
• Open an account in Singapore
- Search for the company you want to trade in our award-winning platform
- Choose your position and size, and your stop and limit levels
- Place the trade
Latest market news
Yesterday 01:32 PM
Yesterday 09:35 AM
Yesterday 07:23 AM
Yesterday 04:48 AM
Yesterday 12:17 AM
July 25, 2024 10:39 PM
Latest Trade Ideas articles

Yesterday 09:35 AM

Yesterday 12:17 AM

July 25, 2024 10:39 PM

July 25, 2024 05:30 PM