July 13, 2021 3:45 AM
China overview:
Events in China play a critical role in determining the price of base metals, both in the short term and the long term. This is because China accounts for 50-60% of base metals demand and around 73% of the world's iron ore imports.
China’s credit impulse turned negative towards the end of 2020 as policymakers emphasised the need for more “prudent” policy and to minimise financial risks. The slowdown in credit momentum along with officials “jawboning” lower commodity prices has reduced demand and a moderation of key metal prices, more noticeable since mid-May.
However, data released last week show Chinese authorities begun to ease conditions in June as both total social financing and new yuan loans increased by more than expected. Total social financing was 3.67 trillion yuan ($566 billion), jumping from 1.9 trillion yuan in May and higher than the 2.89 trillion yuan forecast. Financial institutions offered 2.12 trillion yuan of new loans in June, higher than the 1.5 trillion yuan in May, exceeding the consensus forecast of 1.80 trillion yuan.
Supplementing the rise in aggregate finance, the PBOC cut the Reserve Requirement Ratio (RRR) by 50bps on Friday, effective July 15th. In the accompanying statement, the PBOC reiterated that the RRR cut was in response to the difficulties small to medium-sized corporates faced amid higher commodity prices.
The PBOC’s dovish shift confirms it remains attentive in managing the downside risks to the Chinese economy. Furthermore the PBOC’s easing measures should limit the short term downside risks in industrial metals such as copper and iron ore.
Gold
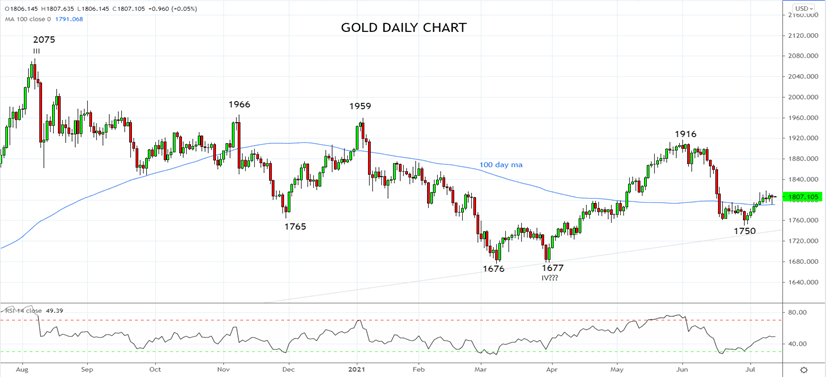
As a precious metal, gold is heavily influenced by macro events. The Federal Reserves’ hawkish pivot in June had a sharp impact on the price of gold, sending it down to a low near $1751. The sell-off a function of gold's negative correlation with rising US real yields/interest rates and a stronger US dollar.
Despite a fall in US real yields in July and the US dollar failing to break higher, investor's attitudes towards gold remains cautious. This is likely to reflect an expectation that the next big move in US yields and the US dollar will be higher and that risks for gold are to the downside.
That said it's important to note that gold has held and bounced from the trendline support currently near $1743, coming from the May 2019, $1266 low which keeps the uptrend in gold intact for now.
However, should gold break below the support at $1750/40 it would indicate a retest of the $1676 low of March is underway, before $1500.
Silver
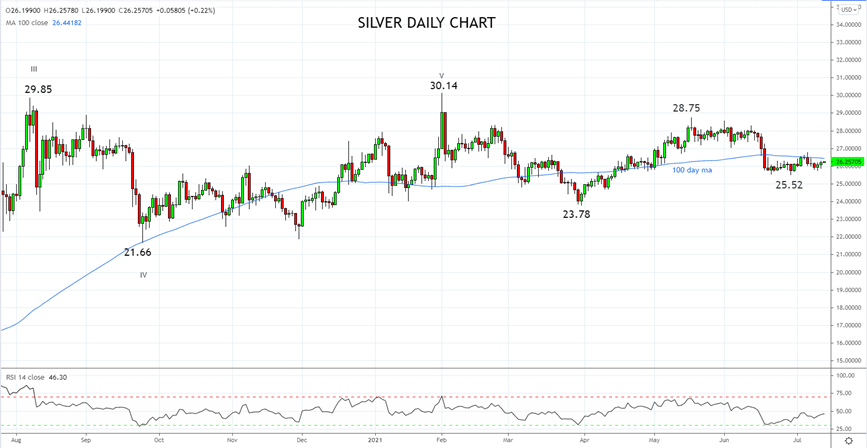
Although silver is part precious metal, and part industrial metal the key driver of the decline in the silver price was the hawkish shift by the Federal Reserve in June for the reasons outlined in gold above.
An expectation that the next big move in US yields and the US dollar will be higher, suggests that the short-term risk for silver is to the downside. In the longer term, a decline into the $22.00/21.00 support region would represent an extremely attractive medium term buying opportunity to benefit from silvers properties as an industrial metal.
Copper
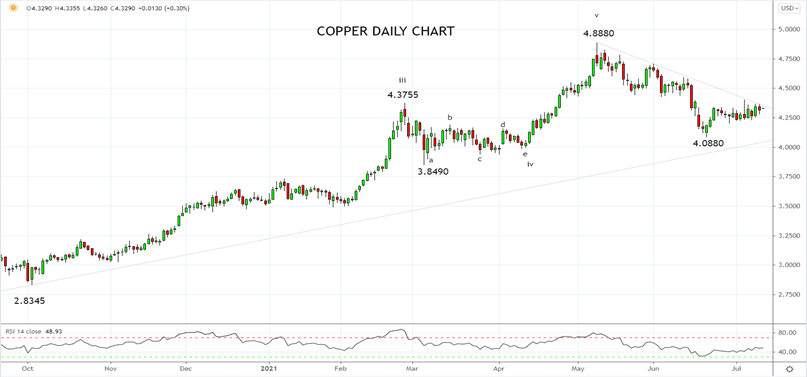
The recent slowdown in China has been a headwind to copper although it has partially been offset by strong demand from the rest of the world. As Q2 is expected to be the peak of the recovery and with global manufacturing PMIs already moving lower and global consumption moving further from goods to services, short term risks for copper remain.
In the medium term, there remains a supply and demand imbalance evident in the copper market. Supply growth has been minimal since 2016 and the copper industry’s ability to increase its reserve base by lowering its cut-off grade is nearing an end.
Three times as much copper is used in electric vehicles than conventional internal combustion engines. This is an example of where increased demand for copper will come from in the clean energy investment cycle. Added to this, proposed changes to Chiles mining royalty regime will crimp appetite to make large investments in Chile which produces 30% of the worlds copper supply.
Technically we remain bullish copper, leaning against uptrend support near $4.00, although still requiring a break/close above key resistance at $4.45ish to increase conviction that a tradable low is in place at $4.08 and that the uptrend has resumed.
Iron Ore
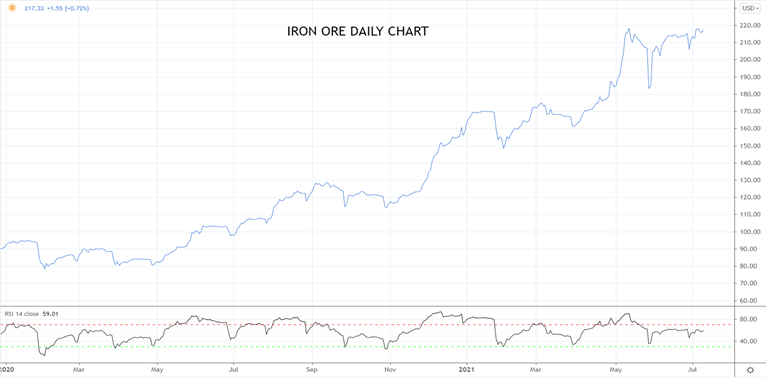
Iron ore prices remain stubbornly high as supply remains constrained. Demand from China which consumes 97% of the iron ore produced by the world’s two largest exporters Australia and Brazil as well as demand from the world Ex China has been strong, supporting prices in the short term.
Profit margins at Chinese steel mills that combine iron ore with coking coke to make steel have turned sharply lower, even negative in recent months. Additionally, there is evidence that local iron ore producers have begun to ramp up production and that Chinese authorities are turning to scrap steel to reduce reliance on iron ore imports.
Finally, efforts to diversifying iron ore supplies including the building and development of the Simandou mine in West Guinea which comes on later this decade, will negatively impact the price of iron ore. As such a medium term price of $150p/t looks more reasonable than the current price near $217 p/t.
Source Tradingview. The figures stated areas of the 13th of July 2021. Past performance is not a reliable indicator of future performance. This report does not contain and is not to be taken as containing any financial product advice or financial product recommendation
Latest market news
Yesterday 01:32 PM
Yesterday 09:35 AM
Yesterday 07:23 AM
Yesterday 04:48 AM
Yesterday 12:17 AM
July 25, 2024 10:39 PM
Latest Forex articles

Yesterday 12:17 AM

July 25, 2024 10:39 PM

July 25, 2024 03:59 PM

July 25, 2024 04:37 AM