April 29, 2021 12:57 PM
Q1 GDP Surges, but that’s old news. Where to now?
The US Advanced GDP for Q1 was 6.4% vs 6.1% expected and 4.3% in Q4 2020. Last year as the pandemic began, the Q1 reading was -5%. (As a reminder, Q2 last year was -31.4% and Q3 was +33.4%!) The GDP deflator, or price index, was 4.1% vs an expectation of 2.5% and 1.9% in Q4. However, according the Fed Chairman Powell’s press conference yesterday, the inflation in transitory. An increase in personal consumption expenditures (PCE) was the primary contributor to the stronger GDP print, but note that many people received stimulus checks during Q1. Federal, state, and local government also contributed to the strong print. Remember that GDP is backward looking and doesn’t really tell us where the economy is headed.
The more important data of the morning was the Initial Jobless Claims, which fell to 553,000, the lowest level since the pandemic began. Next week, the US will release Non-Farm Payrolls for April. Current expectations are for +900,000 jobs to have been added to the economy. Recall that in March, +916,000 jobs were added! Given the expectations that the US economy will continue to reopen as the vaccine rollout continues, these numbers should continue to be strong over the next few months, particularly in the travel and hospitality industries. With continued reopenings, one may expect that the spending will continue, even without stimulus checks. Never underestimated the power of the American consumer.
USD/JPY had moved lower from April 1st until April 23rd, when the pair tested the 32.8% Fibonacci retracement level from the January 5th lows to the March 31st highs, near 107.50. A confluence of support was briefly taken out before reversing. These included horizontal support near 108.16 and a long term downward sloping trendline (red), dating back to May 2015. This week, USD/JPY has been moving higher failing to hold below those levels.
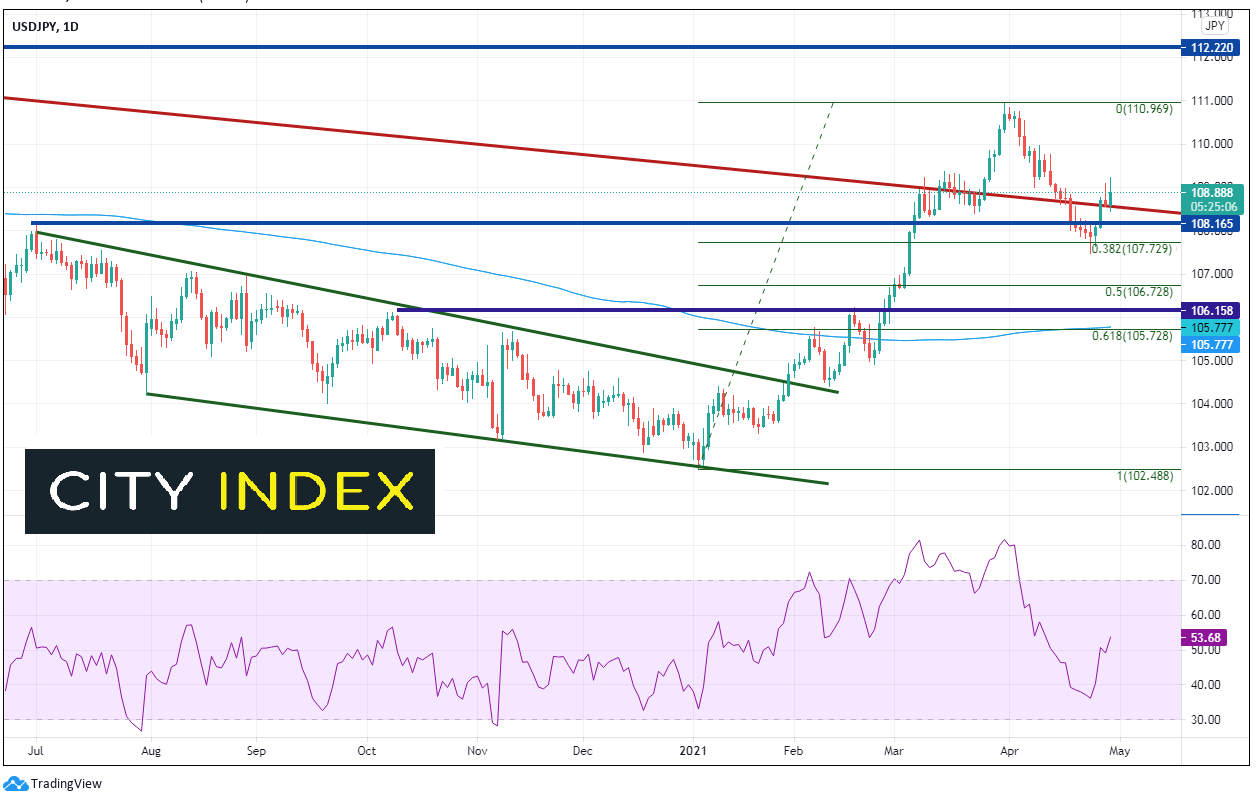
Source: Tradingview, City Index
Much of the move in USD/JPY can be attributed to the move the yields. There is currently a +0.88 correlation between USD/JPY and US 10-year yields (bottom of chart below). A correlation coefficient of +1.00 means that the 2 assets move together on a 1 to 1 basis. +0.88 is close. Notice that the pullback in yields from the highs did not even reach the 38.2% Fibonacci retracement level over the same timeframe as USD/JPY. This indicates a weak pullback and that yields may continue higher. Are bond traders calling Powell’s bluff and trying to force him to raise rates sooner than he would like?
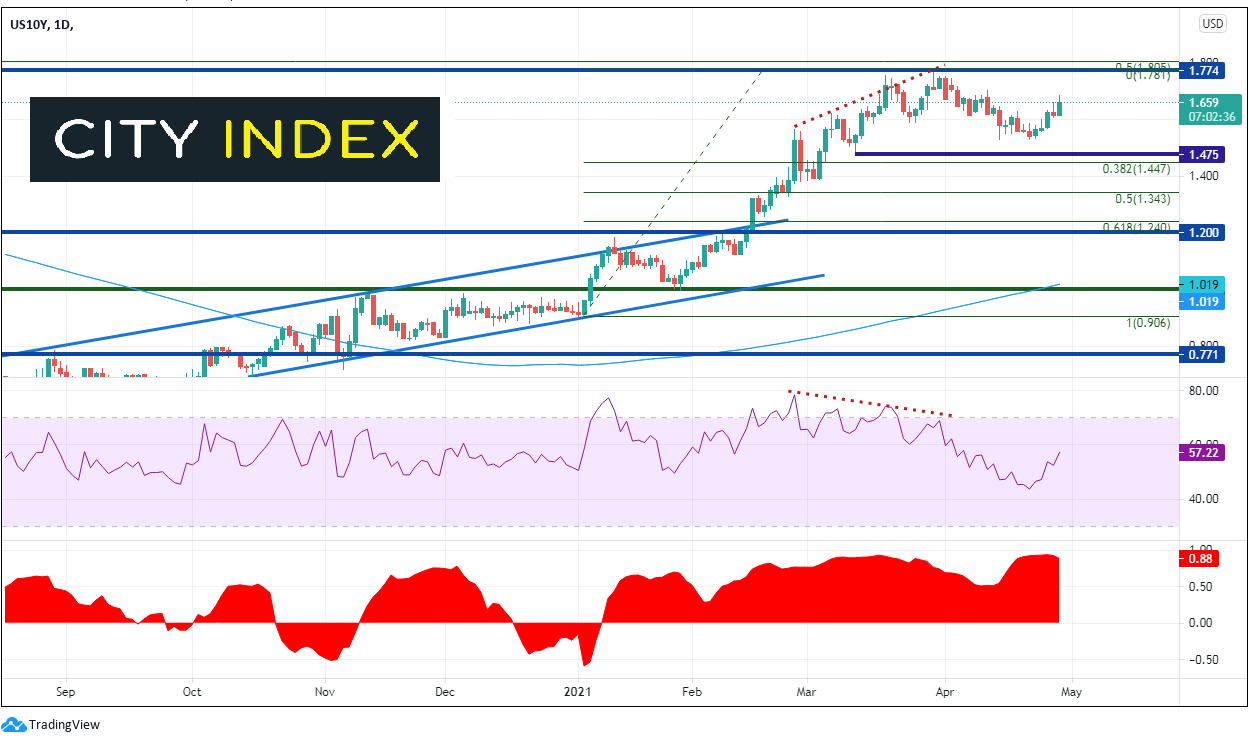
Source: Tradingview, City Index
The reason doesn’t matter. But if US yields continue to move higher, than given the current correlation to USD/JPY, the currency pair should move higher as well.
Learn more about forex trading opportunities.
Latest market news
Yesterday 01:32 PM
Yesterday 09:35 AM
Yesterday 07:23 AM
Yesterday 04:48 AM
Yesterday 12:17 AM
July 25, 2024 10:39 PM
Latest Forex articles

Yesterday 12:17 AM

July 25, 2024 10:39 PM

July 25, 2024 03:59 PM

July 25, 2024 04:37 AM