


January 13, 2022 4:27 PM
One day after the US released CPI (see recap here), the Producer Price Index (PPI) was released. The data showed that PPI increased by 9.7% YoY in December vs 9.8% expected. However, the November print was revised up from 9.6% YoY to 9.8% YoY, an increase of 0.2%. This makes the December print stronger than it seems on the surface (which is a slight miss). In addition, the Core PPI print, which excludes food and energy, was 8.3% YoY vs an expectation of 8%. As with the headline print, the core PPI for November was also revised higher from 7.7% YoY to 7.9% YoY , an increase of 0.2%. This, again, makes the December print stronger than first at glance.
Forecasting 2022 inflation: Transitory no more?
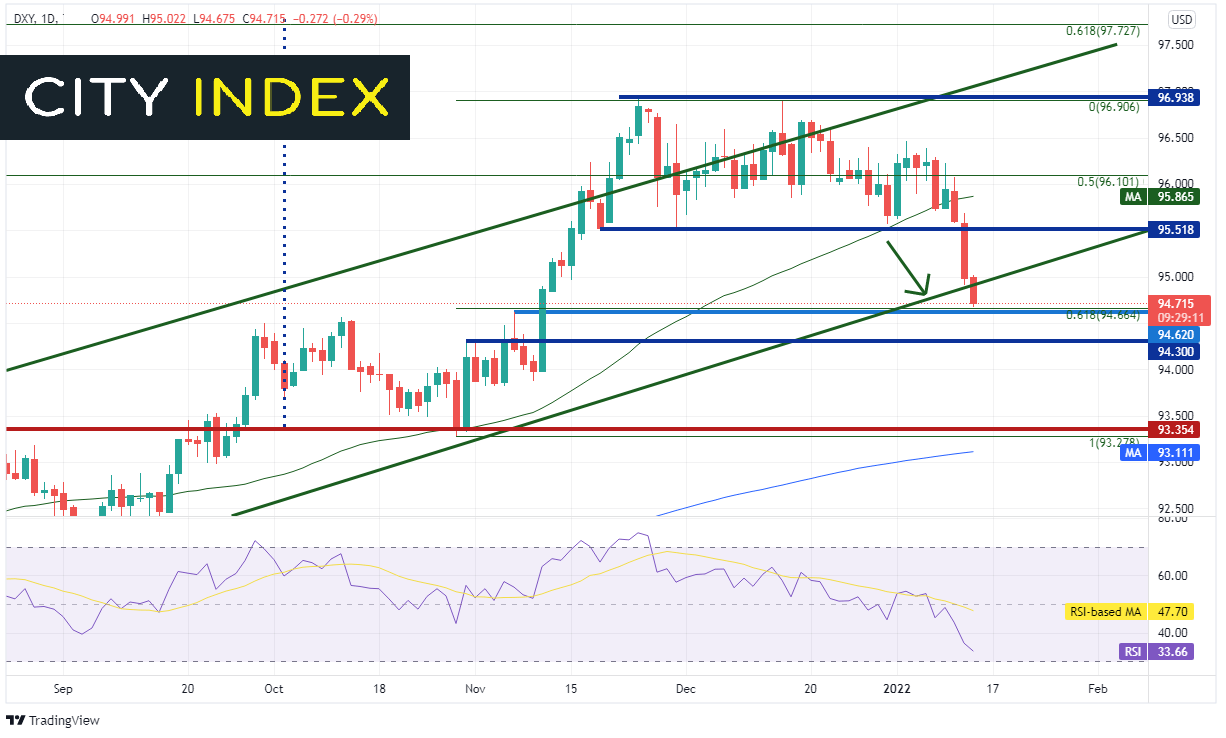
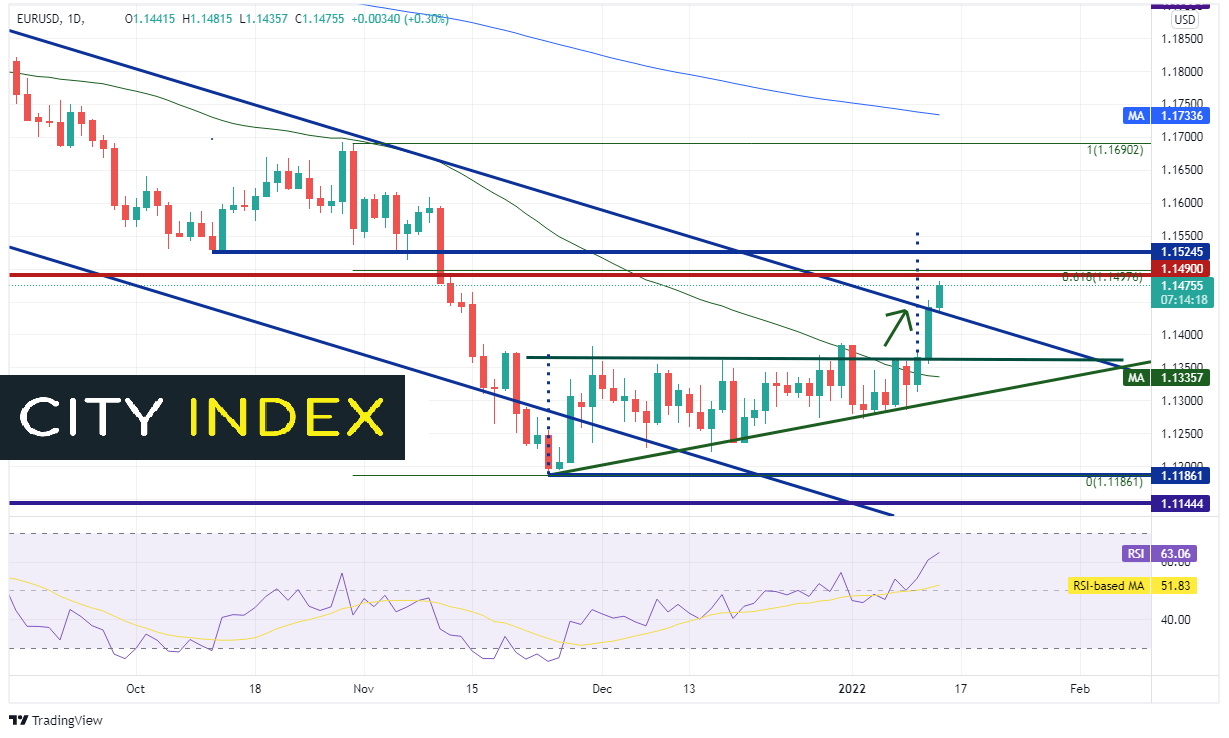
After yesterday’s 7% print handle in headline CPI, the US Dollar sold off and EUR/USD went bid. The US Dollar Index had the largest one day sell-off since November. This could continue today, however watch for a pause as price reaches strong support and resistance levels.
The DXY has broken below the bottom trendline of the long-term channel (green) that the index had been in since May 2021 and is testing the 61.8% Fibonacci retracement from the lows of October 28th, 2021 to the highs of November 24th, 2021, near 94.66. There is also horizontal support in this area from previous highs at 94.62. If the DXY fails to hold the support, there is additional minor horizontal support at 94.30. Below there, price can fall to the long-term horizontal support, the October 28th, 2021 lows, and the 200 Day Moving Average between 93.11 and 93.35. If the DXY holds current levels, watch for an initial bounce back to the broken channel trendline near 94.95.
Source: Tradingview, Stone X
Trade DXY now: Login or Open a new account!
• Open an account in the UK
• Open an account in Australia
• Open an account in Singapore
EUR/USD provides a similar, but opposite picture. The pair moved higher yesterday, crossing above the top trendline of the channel it has been in since May 2021. However, unlike the DXY, EUR/USD had broken out of a rising triangle pattern as well. The target for the breakout of the rising triangle is near 1.1555. To get to target, the pair must break through strong resistance at long-term horizontal resistance and the 61.8% Fibonacci retracement from the highs of October 28th, 2021 to the lows of November 24th, 2021, near 1.1490. Above there is minor horizontal resistance at 1.1525 and then the target near 1.1555. If the EUR/USD resistance holds, watch for a pullback to the broken channel trendline near 1.1477.
Source: Tradingview, Stone X
Trade EUR/USD now: Login or Open a new account!
• Open an account in the UK
• Open an account in Australia
• Open an account in Singapore
December CPI and PPI both came in hotter than expected, yet the US Dollar moved lower after the releases. How much more room to EUR/USD and the DXY have to run? Watch near term support in the DXY and resistance in EUR/USD to find out!
Learn more about forex trading opportunities.
Latest market news
Yesterday 03:00 PM
Yesterday 01:12 PM
Yesterday 11:14 AM
Yesterday 08:28 AM
April 24, 2024 03:30 PM
Latest Trade Ideas articles
Yesterday 03:00 PM
Yesterday 11:14 AM
April 24, 2024 11:00 AM
April 24, 2024 08:15 AM