

- It feels like the global economy is at a tipping point as rate hikes clamp down hard on activity
- The longer central banks push a higher for longer rates path, the harder the economic downturn is likely to be
- In such an environment, large cap tech like the Nasdaq 100 may outperform to the detriment of cyclicals such as crude oil
It feels like we’ve reached the part of the economic cycle where the pain sets in. Growth indicators are rolling over while central banks continue to push the narrative that interest rates will be higher for longer.
For the Nasdaq and crude oil, such a scenario points to the likelihood of divergent performance over the medium-term as the focus turns from attempting to slow economic activity to trying to avoid significant economic scarring as the next downturn begins.
We’re late cycle
We’re late cycle – make no bones about it.
Restrictive monetary policy is suffocating activity, in some places faster than others. Lead indicators are rolling over hard, meaning the switch in focus away from inflation to rising unemployment cannot be far away. After the most aggressive interest rate hiking cycle of modern times, the lag effects could be far harsher than many expect. They’ve been mild up until now.
PMI reports flash warning signal for global growth
The latest batch of Purchasing Index Managers’ (PMI) reports for October only reinforce this point. For the first time in the post pandemic era, the world’s big three economies – the Eurozone, United States and China – faltered simultaneously.
Europe’s problems have been obvious for a while, even if the ECB seems intent on continuing to look through the rearview mirror at inflation. The US, even with most mortgagors locked into rock-bottom rates for years, also looks to be losing its economic exceptionalism tag as its massive services sector joins manufacturers in the doldrums. But the really big surprise has been China which, despite numerous economic support measures announced over the past few months, saw activity soften again, deviating from the modest recovery trend.
With those massive economies spluttering, it was no surprise to see the J.P. Morgan Global Composite PMI slide to 50.0 in October, indicating activity, collective, is stalling worldwide. Here’s the report card on the survey’s subsectors, with highlighting showing those which deteriorated from a month earlier.
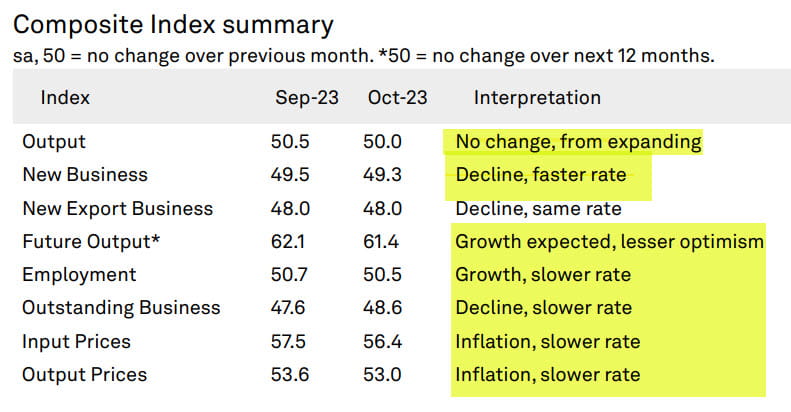
Yes, all bar one of them. And even that was weak.
And this before much of the monetary tightening fully kicks in. There should be little surprise to see bond yields now shifting lower across curves in the developing world, led by the back end. The PMIs are not the only lead indicator looking sick. The bond market is saying the outlook for growth and inflation is diminishing rapidly. If these concerns begin to filter through to central bankers, the next playbook will before yield curves to bull steepen as interest rates are cut.
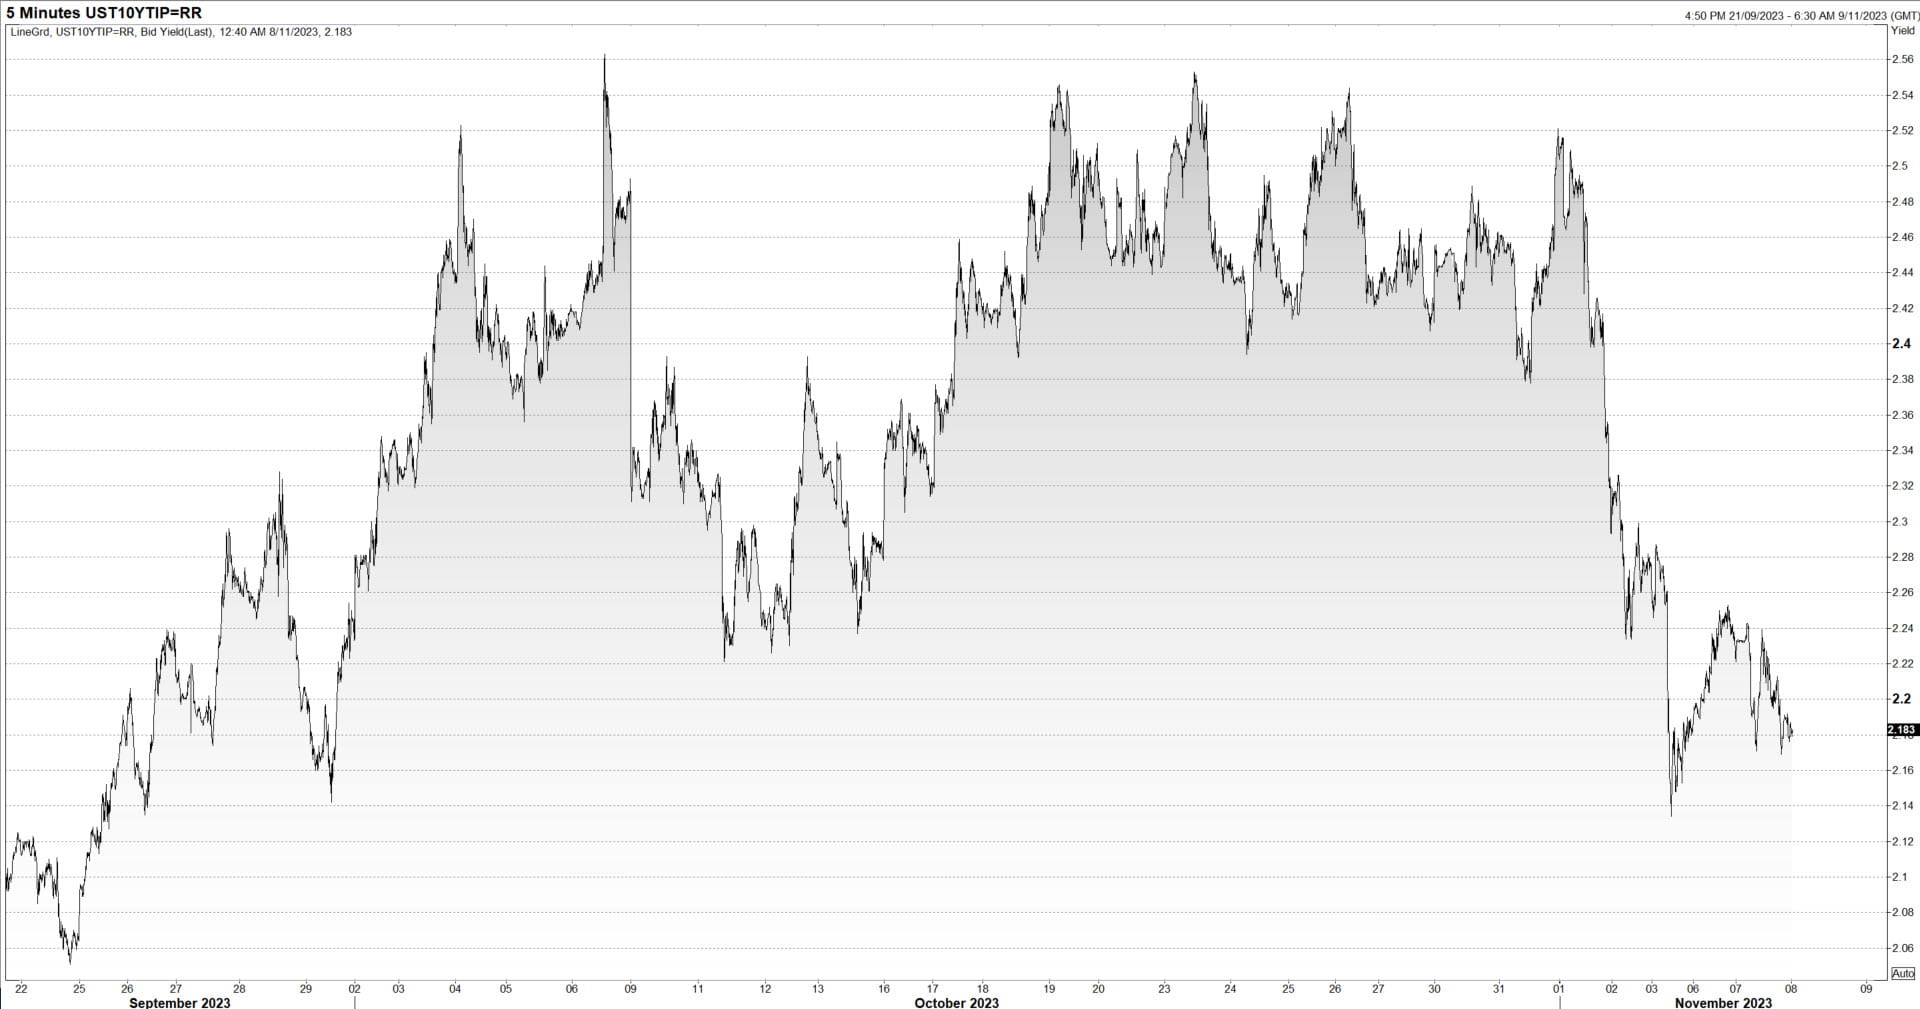
US 10-year real bond yields down sharply
Quality is king
It’s the type of environment where quality growth stocks, who are less reliant on funding markets than firms with weaker balance sheets, will typically do well, often managing to increase market share either by outlasting rivals or simply acquiring them for a discount.
Nasdaq move looks far more than short covering
While not every name in the Nasdaq 100 can lay claim to be quality stock, the largest constituents by market capitalisation can. And even with eye-watering valuations, falling interest rates and access to capital markets means they may conceivably become a lot bigger.
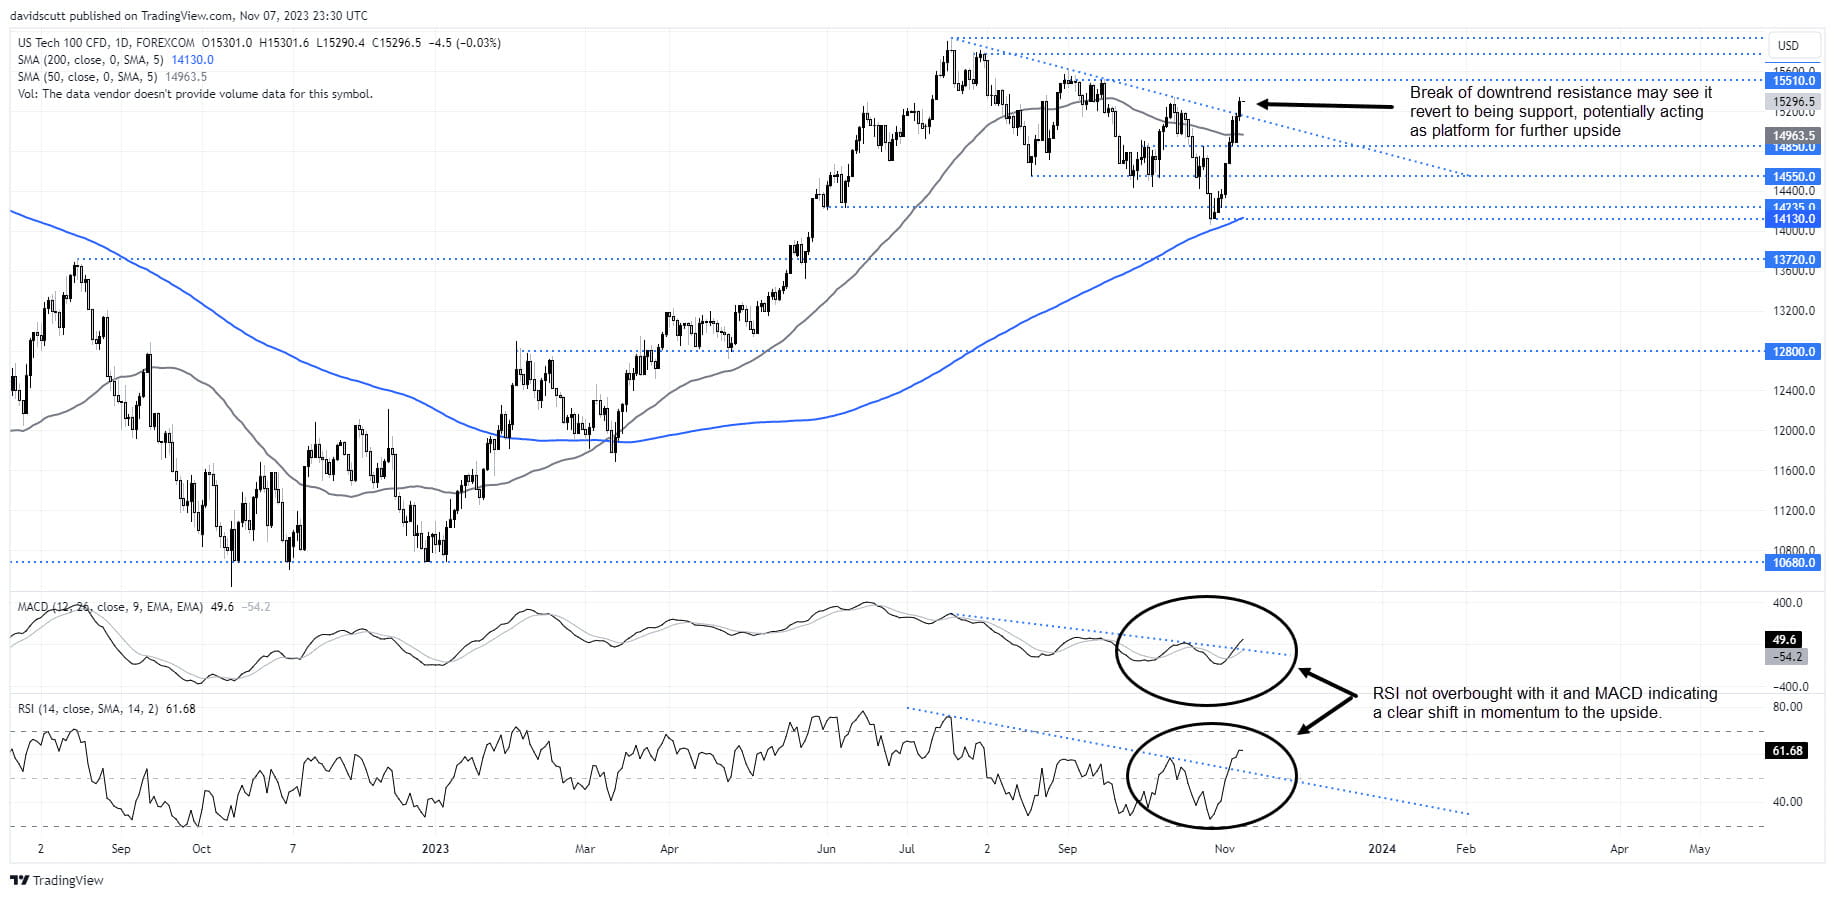
Given the signal from the bond markets over the past fortnight looks to be the real deal, it bolsters the case for the rebound in the Nasdaq 100 being far more than just a short covering rally. It’s punctured resistance level after resistance level over the past week, including taking out downtrend resistance that successfully capped attempted breakouts over the past few months. Even after the move we’ve seen, with nominal and real yields tumbling, bulls will likely be emboldened to now push the index to fresh highs.
The former downtrend may now act as support, allowing fresh and established longs to use it as protection with a stop-loss placed below. Looking above, resistance around 15500 and 15770 are the next levels to watch, with a break of the latter likely to lead to a retest of the 2023 highs.
Right now, RSI is not overbought on the daily and, like MACD, is clearly indicating a change of momentum. Therefore, in the absence of a start shift in the macro environment, dips may prove to be shallow.
Crude collapses through 200-day moving average
While softening economic conditions may help the Nasdaq, it’s unlikely to be a tailwind for crude oil. There’s a war in the Middle East. Two of the world’s largest producers are limiting seaborne supply. Crude should be flying right now but isn’t. That’s telling.
It looks terrible on the daily, breaking trend support last week before slicing through its 200-day moving average on Tuesday. Talk of $100 bucks a barrel seems like something from an eternity ago even though it’s only been six weeks.

While there’s grounds for a bit of short-covering after the precipitous fall crude has experienced, in the absence of a rapid move by central banks to cut rates or significant escalation of the conflict in the Middle East, sellers are likely to be lining up around the 200-day moving average given how respectful price has been of it in the past.
Below, crude has done a lot of work around $73.80 previously, making that the first obvious target for shorts. Below that, there’s little major visible support until $67. On the topside, resistance above the
-- Written by David Scutt
Follow David on Twitter @scutty
How to trade with City Index
You can trade with City Index by following these four easy steps:
-
Open an account, or log in if you’re already a customer
• Open an account in the UK
• Open an account in Australia
• Open an account in Singapore
- Search for the market you want to trade in our award-winning platform
- Choose your position and size, and your stop and limit levels
- Place the trade
Latest market news
Yesterday 01:32 PM
Yesterday 09:35 AM
Yesterday 07:23 AM
Yesterday 04:48 AM
Yesterday 12:17 AM
July 25, 2024 10:39 PM
Latest Equities articles


June 8, 2024 02:00 AM

June 3, 2024 05:56 AM

June 3, 2024 03:34 AM