

- Nasdaq 100 analysis: Tech optimism starting to wane following disappointing updates
- All eyes on FOMC and Powell today – will the Fed pushback against rate cut bets?
- Nasdaq 100 technical analysis shows only modest damage to bull trend – for now
US index futures traded mixed with the Dow futures rising alongside firmer European markets, while the technology-heavy Nasdaq futures underperformed following earnings from a few tech giants that failed to live up to high expectations, ahead of a busy next few days in the markets.
Are US investors finally applying the brakes on the rally that has propelled Wall Street stocks to record highs in recent week? Last week it was Intel which provided a gloomy forecast. Last night, it was Alphabet (-5.6%), AMD (-6.6%) and Microsoft (-1.3%) all dropping in pre-market as their earnings results and updates didn't match the A.I. hype. With the FOMC policy decision and US non-farm payrolls report to come, there’s also the added risk that expectations about interest rate cuts will be pushed further out this week.
All eyes on FOMC and Powell
At tonight's FOMC meeting, the key message from the Fed is likely to be one that can be best described as: "Hey, we're not rushing into anything." Recent FedSpeak, most notably by Christopher Waller, suggests a March rate cut is not going to be on the cards, despite the market’s refusal to let it go. According to the CME FedWatch tool, investors are still attaching a 45% probability to a March rate cut. A strong pushback from the Fed means there’s enough room for the dollar to rise and a lot more for stocks to potentially fall.
It would be a real surprise to me if the Fed turns out to be dovish. We have seen consistently strong data from the US, pointing to an economy that is far from heading into a recession or a hard landing. The Fed will likely make it clear that, while inflation and the job market are heading in the right direction on the path towards achieving a soft landing, the central bank would not be in a rush to cut rates, and when they do decide to cut, they won't be as speedy as before.
Recent US macro pointers, like the December JOLTS data release yesterday which showed more job openings than expected, makes it difficult to justify an aggressive rate-cutting programme. The market thinks the Fed will deliver about 130 basis points of rate cuts this year. Any pushback on that front from the Fed could be a positive outcome for the dollar, and potentially negative for stocks.
Meanwhile, today's the US Quarterly Refunding announcement, which might bring some volatility in the long end of the Treasury market, could also impact equities. If the US Treasury has misjudged how much the market wants longer-dated Treasury supply, it could mean higher bond yields. If so, this may hurt those high-flying tech stocks and help dollar in the favour of riskier currencies. On the flip side, if yields drop then this may keep the bears at bay.
Nasdaq 100 analysis: Tech optimism starting to wane?
Despite legitimate reasons for investor optimism, the concern arises as to whether this positivity might be overly optimistic considering the prevailing economic uncertainties. Is it justifiable for investors to acquire equities at these levels amid a backdrop of macro-scale uncertainty?
The surge in the market has been fuelled by investor confidence in the likelihood of major central banks, such as the Fed and ECB, lowering interest rates. However, these expectations have been pushed back due to more assertive statements from central banks, as well as forecast-beating data, raising the possibility that the Fed may convey a more hawkish message today.
On a micro level, another issue arises concerning the limited involvement of non-tech stocks in the rally. Some investors speculate that the optimism surrounding A.I. might be indicative of irrational exuberance, especially as many companies have not fully capitalized on generative A.I. yet. The latest earnings results from Alphabet, AMD and Microsoft didn't match the A.I. hype, adding to last week’s gloomy forecast by Intel and Tesla’s underwhelming earnings.
Moreover, the rising shipping costs resulting from the situation in the Red Sea are anticipated to drive up input expenses. This could trigger another bout of inflation, potentially causing delays in implementing interest rate cuts. The question thus arises: will the Fed address this risk during its policy decision today?
Meanwhile, China's efforts to prop up its underperforming stock markets provided a boost to investor confidence last week. However, the initial optimism has waned this week. This is a red flag.
Nasdaq 100 technical analysis
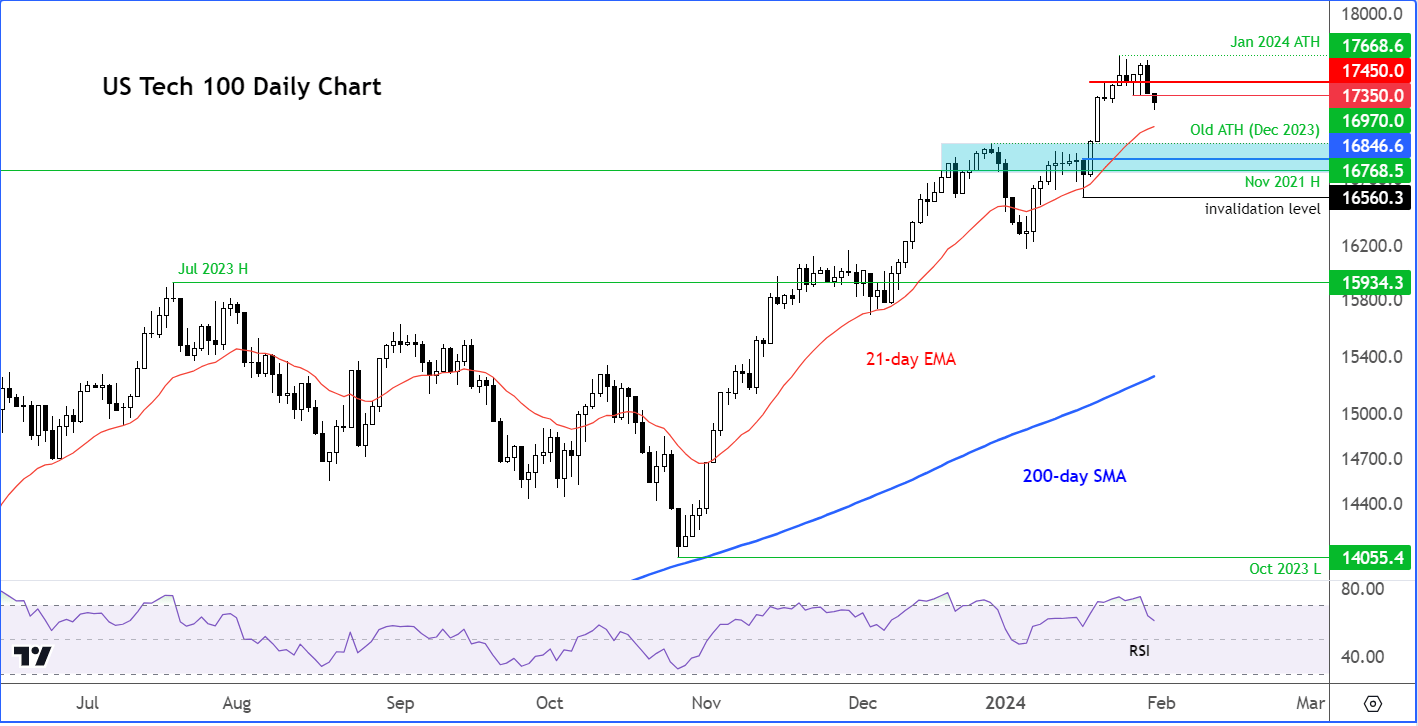
Source: TradingView.com
Prior to this two-day drop, the Nasdaq had already given us a couple of warning signals in the last few days to suggest the rally may be pausing for a breather. So far, this pullback is not too alarming, and many would see it a normal retracement inside what has been a very strong bullish trend. The bears will only celebrate once they cause real damage to the trend, by creating a lower low or a key reversal pattern.
The warning signs were there that we will see some sort of a pullback, with the index reaching overbought levels as indicated on the sub chart by Relative Strength Index (RSI) moving above the threshold of 70. The RSI has now fallen, so some of the “overbought” conditions have been worked off. What’s more, the index had created a couple of inverted hammer candles to suggest the bullish momentum was fading, in part because of profit-taking.
If we do see the correction extend later today or week, then it is important to highlight your key support levels where dip-buyers might step in or the bears will be looking to take profit on their short positions.
The key support area is highlighted in blue on my chart, marking the area between the previous two all-time highs. The last major one was made at the end of last year at 16970. This level is now the most important support should we get a decent pullback from these elevated levels. The next level below that was the high from November 2021, at 16770. So, anywhere in the 16770-16970 range is where I would be expecting to see a tradable bounce.
In terms of resistance, 17350 and then 17450 are now the levels to watch on the upside. These levels were previously support, and so may turn into resistance moving forward. If and when we break above these levels cleanly, then the next upside target would be the all-time high from last week at 17668.
Video analysis on crude, gold, copper and FX majors
-- Content created by Fawad Razaqzada, Market Analyst
Follow Fawad on Twitter @Trader_F_R
How to trade with City Index
You can trade with City Index by following these four easy steps:
-
Open an account, or log in if you’re already a customer
• Open an account in the UK
• Open an account in Australia
• Open an account in Singapore
- Search for the company you want to trade in our award-winning platform
- Choose your position and size, and your stop and limit levels
- Place the trade
Latest market news
Yesterday 01:32 PM
Yesterday 09:35 AM
Yesterday 07:23 AM
Yesterday 04:48 AM
Yesterday 12:17 AM
July 25, 2024 10:39 PM
Latest US Tech 100 articles

June 6, 2024 02:00 PM

April 28, 2024 08:00 AM

April 24, 2024 03:30 PM

March 26, 2024 06:08 PM