September 8, 2022 5:24 PM

Mexico’s August CPI was 8.7% YoY vs 8.67% YoY expected and a July reading of 8.15%. This is the highest level since December 2000! In addition, the Core CPI for August was 8.05% YoY vs 8.04% YoY expected and 7.65% YoY in July. This is also the highest level since 2000. The Bank of Mexico hiked rates for the 10th time in the current rate hike cycle by 75bps to 8.5% on August 11th, citing persistent inflationary pressures. Banxico also revised higher inflation for Q3 2023 but said that it still expected inflation to converge at its 3% target in Q1 2024. The Bank of Mexico doesn’t meet again until September 29th. How much will the central bank raise rates? It may depend on how much the Fed hikes when it meets on September 21st. Banxico appears that it may be trying to keep up the pace with the Federal Reserve, who last hiked 75bps and is expected to hike an additional 75bps at the next meeting.
USD/MXN has been making lower highs since reaching the pandemic highs on April 6th, 2020 at 25.0125. On January 20, 2021, price reached a low of 19.5527, which has acted as the lower boundary of a band of support since. The upper boundary of the range is near 19.7000. Price has traded between these levels numerous times, only to bounce to a lower high each time. On May 30th, 2022, USD/MXN briefly broke through the bottom of the support area, only to be halted at support from a downward trendline dating to November 2021. As is often the case, when price fails to break through one side of a pattern, it moves to test the opposite side of the pattern. USD/MXN bounced and briefly traded above the downward sloping trendline dating to the pandemic highs, near 21.0541, only to pull back under the trendline once again. The pair has been oscillating around the 20.0000 psychological level since August 10th.
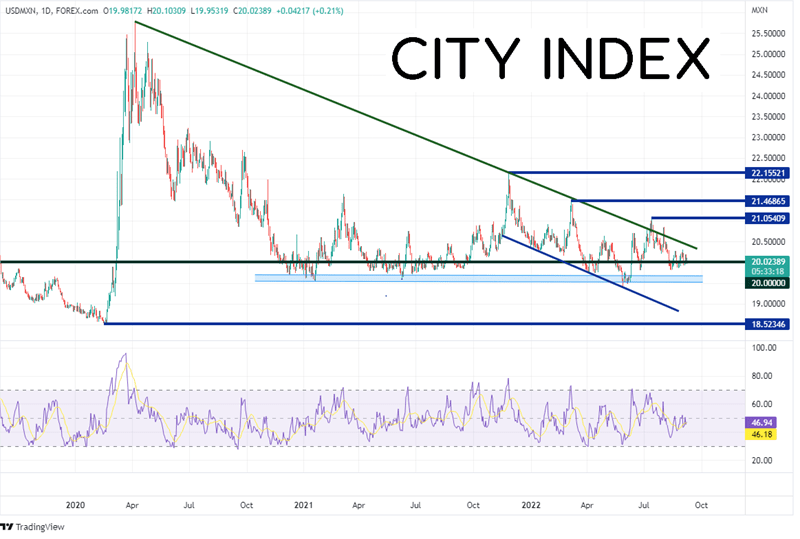
Source: Tradingview, Stone X
Trade USD/MXN now: Login or Open a new account!
• Open an account in the UK
• Open an account in Australia
• Open an account in Singapore
On a 240-minute timeframe, USD/MXN is in the process of forming a pennant. The breakout from a pennant is expected to be in the direction of the prior trend, which is lower. First support is at the lows of August 15th at 19.8127. Below there, price can move back into the band of support between 19.5527 and 19.7000, and then the lows from May 30th at 19.4136. However, if price moves out of the top of the pennant, resistance is at the highs of September 1st at 20.2943 and then the long-term downward sloping trendline (green) from the daily timeframe near 20.4170. Above there, the next level of resistance is at the 50% retracement from the highs of July 14th to the lows of August 15th at 20.4346.
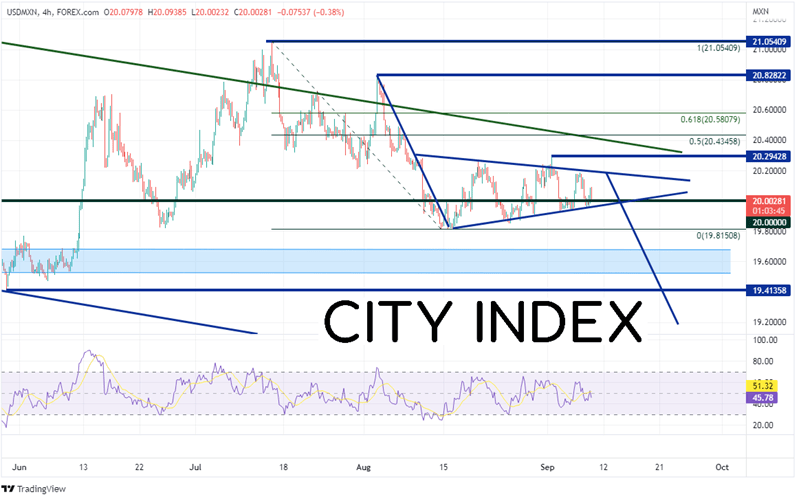
Source: Tradingview, Stone X
Mexico’s CPI continues to climb. As such, so does the value of the Peso. How much higher can the Peso go vs the US Dollar? Bounces in USD/MXN have been sold into on a consistent basis dating back to the highs of the coronavirus pandemic. The pair is currently trading in a pennant formation. If Banxico continues to hike rates, and if inflation continues to climb, USD/MXN could trade down to the target of the pennant near 19.2000!
Learn more about forex trading opportunities.
Latest market news
Yesterday 01:32 PM
Yesterday 09:35 AM
Yesterday 07:23 AM
Yesterday 04:48 AM
Yesterday 12:17 AM
July 25, 2024 10:39 PM
Latest Forex articles

Yesterday 12:17 AM

July 25, 2024 10:39 PM

July 25, 2024 03:59 PM

July 25, 2024 04:37 AM