

Mexican Peso, USD/MXN Technical Analysis:
- USD/MXN has been in a strong bearish trend over the past year, even as USD-strength has remained in many other FX markets. Peso strength has been driven by carry as rates have remained higher in Mexico than the US, but with inflation continuing to fall in Mexico the scope of that scenario is now in question.
- USD/MXN jumped up to a fresh three month high this morning as the pair broke above the 17.42 level, which likely triggered stops above that that resistance to lead to some additional demand in the market. That price came back in as support this morning before the inflation print, and this keeps the door open for reversal potential from the daily chart. Below I look at the matter from monthly, weekly, and daily time frames.
US Dollar strength continues to run in many FX markets but in USD/MXN, that bullish theme is just starting to show potential after what’s been an aggressively bearish trend over the past year.
While US rates eclipsed that of many major economies the same cannot be said for Mexico, which currently holds an 11.25% central bank rate against the 5.25-5.50% from the Fed. This has allowed the carry in USD/MXN to remain tilted to the short side as investors and traders have been picking on rate divergence, and as long as there’s the potential for the principal of the trade to hold and perhaps even appreciate, that carry can remain as an attractive driver in the trending nature of that market.
This is very similar to what we saw in USD/JPY through the first nine months of last year, as carry trades were bringing more bulls into the market, thereby helping to push topside trends. This added an extra component of attraction to that theme as FX traders had positive carry to go along with a strong bullish trend, and as long as the prospect of continuation was there, a bullish case could be made.
But when the trend started to snap back and the threat of losses to principal began to eclipse those rollover payments, well there wasn’t as much motivation for bulls to hold strong. And this led to the ‘down the elevator’ part of the ‘up the stairs, down the elevator’ nature of trending markets. With the threat of principal losses obviating the attractiveness of the carry, the reversal of those trends can be fast and heavy, much like we saw last year, with USD/JPY erasing 50% of a move over three months – that had taken 21 months to build.
As inflation continues to fall in Mexico, with this morning’s data showing a fresh two and a half year low, the question now is whether a similar scenario is before us in USD/MXN. Like USD/JPY last year ahead of the reversal, the trend here has been running strong for some time after the pair topped-out in April of 2020. There was almost two years of support at the 19.70 Fibonacci level, which is the 38.2 retracement of the big picture major move. That finally gave way in November, right around the time that US inflation had started to fall and the USD had went into reverse. This was also around the same time that the USD/JPY reversal was setting in. That trend ran cleanly in USD/MXN until July of this year.
USD/MXN Monthly Chart
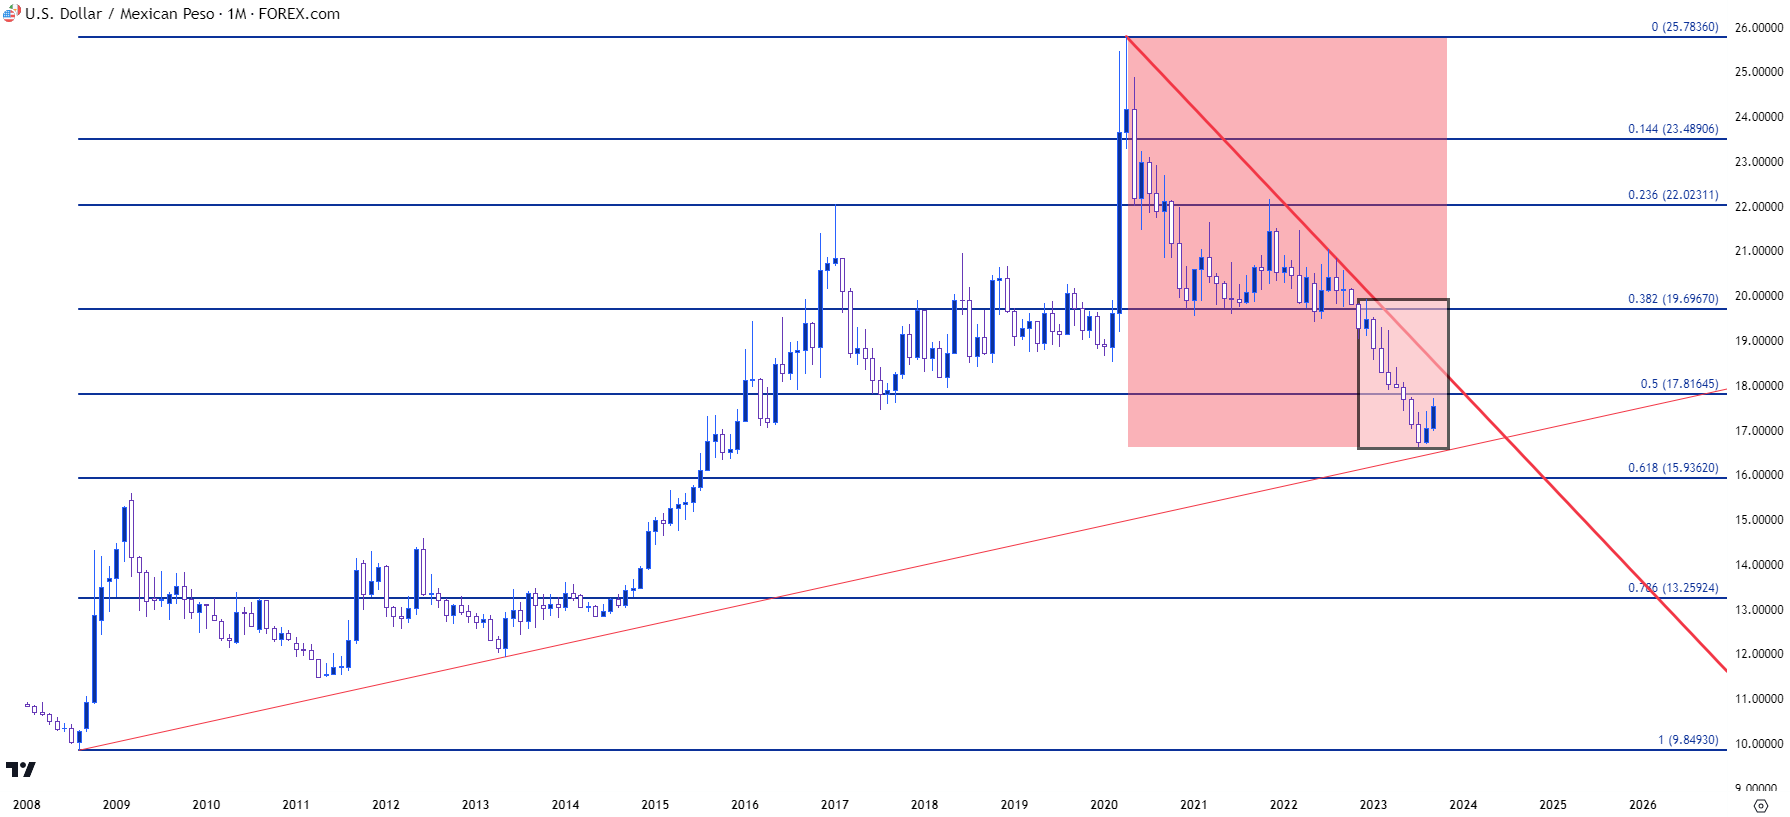
Chart prepared by James Stanley, USD/MXN on Tradingview
USD/MXN Intermediate-Term: The Trend Begins to Turn
From the weekly chart below we can get greater definition of that recent bearish trend, and this is especially interesting given the trajectory of the US Dollar in other markets. But, again this is fairly clear illustration of drive coming from the carry trade.
As Banxico has retained a degree of hawkishness, even as questions have abound about a possible Fed pivot, the pair continued to hold on to the bearish trend into July trade – but that’s around the time that the trend began to stall, as we can see from the two months of support that built at 16.70. To be sure there were attempts from both sides of the market to run a trend but both support and resistance held as the pair ranged for the latter portion of the summer.
Last week produced a bullish outside bar, albeit still within the range, and so far this week we’ve seen that strength continue to allow for breakout to a fresh three-month high.
And this begins to raise the prospect of bigger-picture reversal potential in that well-entrenched bearish trend.
USD/MXN Weekly Price Chart
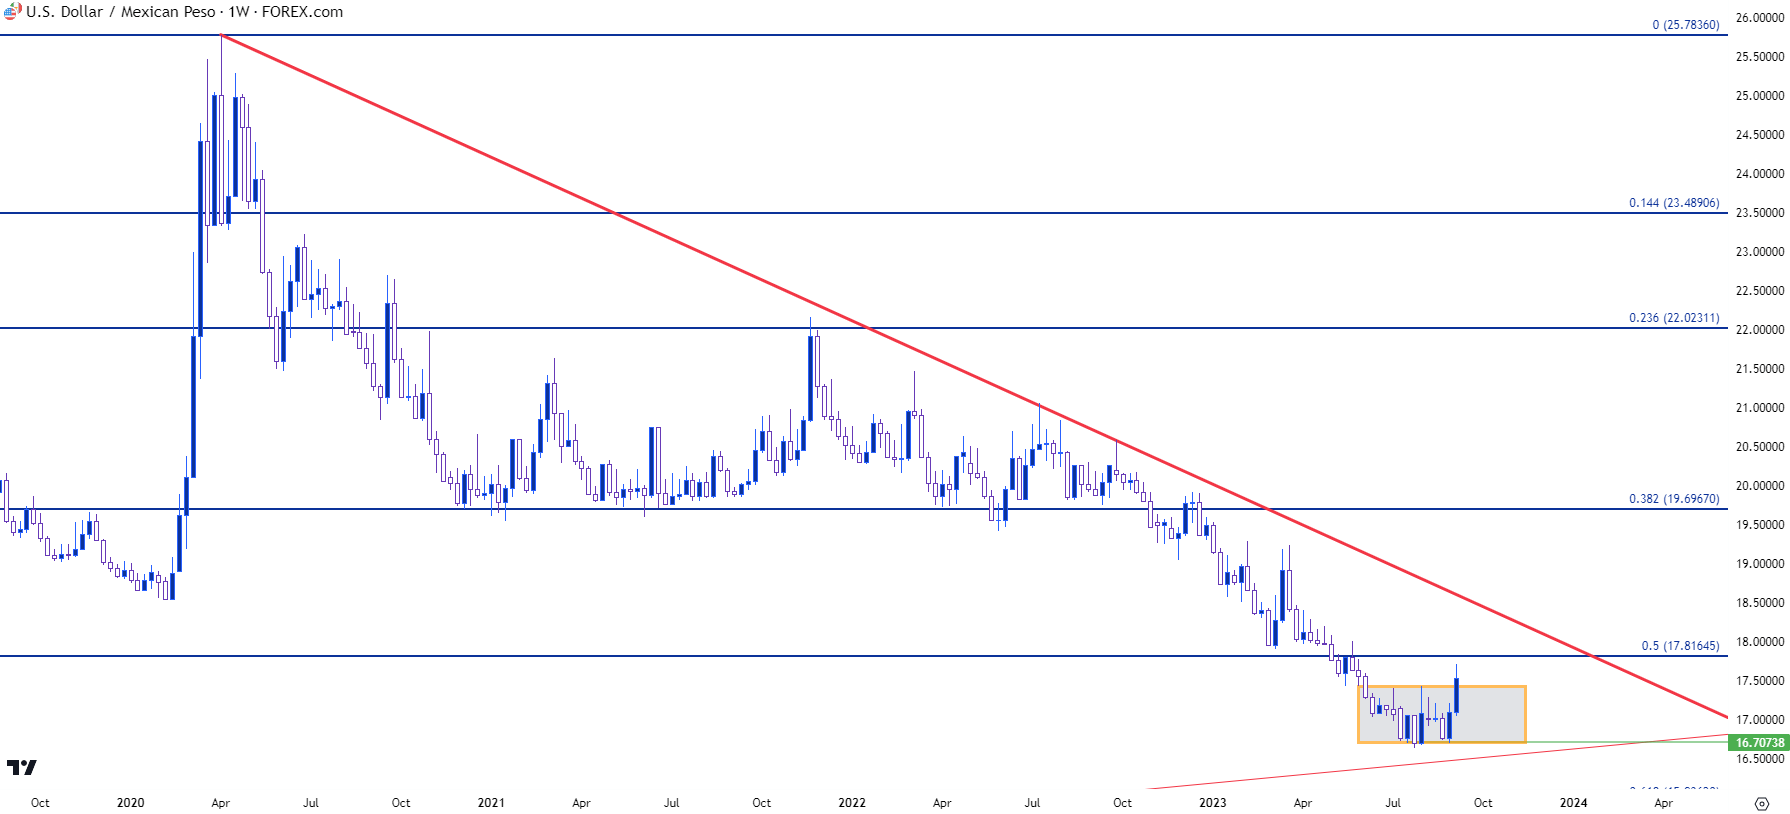
Chart prepared by James Stanley, USD/MXN on Tradingview
USD/MXN Shorter-Term: Initial Steps of Reversal Begin to Show
The first part of a trend reversal is a stall of the move. And after that, it’s the opposing side producing a higher-high that opens that door for reversal a bit wider. After that, the key is a hold of higher-low support and that can then lead in to another higher-high, which then allows for substantiation of the opposing trend and the onset of reversal.
In USD/MXN, the initial steps of that criteria have been met. For the stall, there was approximately three months of ranging price behavior. And then this week showed some additional ignition as yesterday saw prices breakout to a fresh three-month-high.
That move pulled back this morning and this is still at a very early stage but, so far, we’ve seen support on today’s daily bar show at a familiar level of prior resistance at the 17.42 level. This was also a prior spot of support from back in May, and if there is a bullish reversal in the works this would be an aggressive spot for buyers to show their hand.
The drivers around the theme also help to illustrate what’s behind the move, as it was this morning’s release of Mexican inflation data that helped to produce the bounce after that support hold. This can help to align drivers as continued strength in US data to go along with the possibility of more rate hikes out of the Fed can further drive the reverse of that prior rate divergence that drove the carry trade.
If support at 17.42 does not hold, bulls could still retain a lifeline, as there’s another spot of possible higher-low support potential around the 17.20 level. On the topside of price action, there’s a level from the previously mentioned Fibonacci study at 17.8165, after which another prior price swing shows around the 18.00 handle.
If bulls can force a re-test of the 18.00 level, the reversal theme will take on even more potential as there would be yet another higher-high to go along with a higher-low.
USD/MXN Daily Price Chart
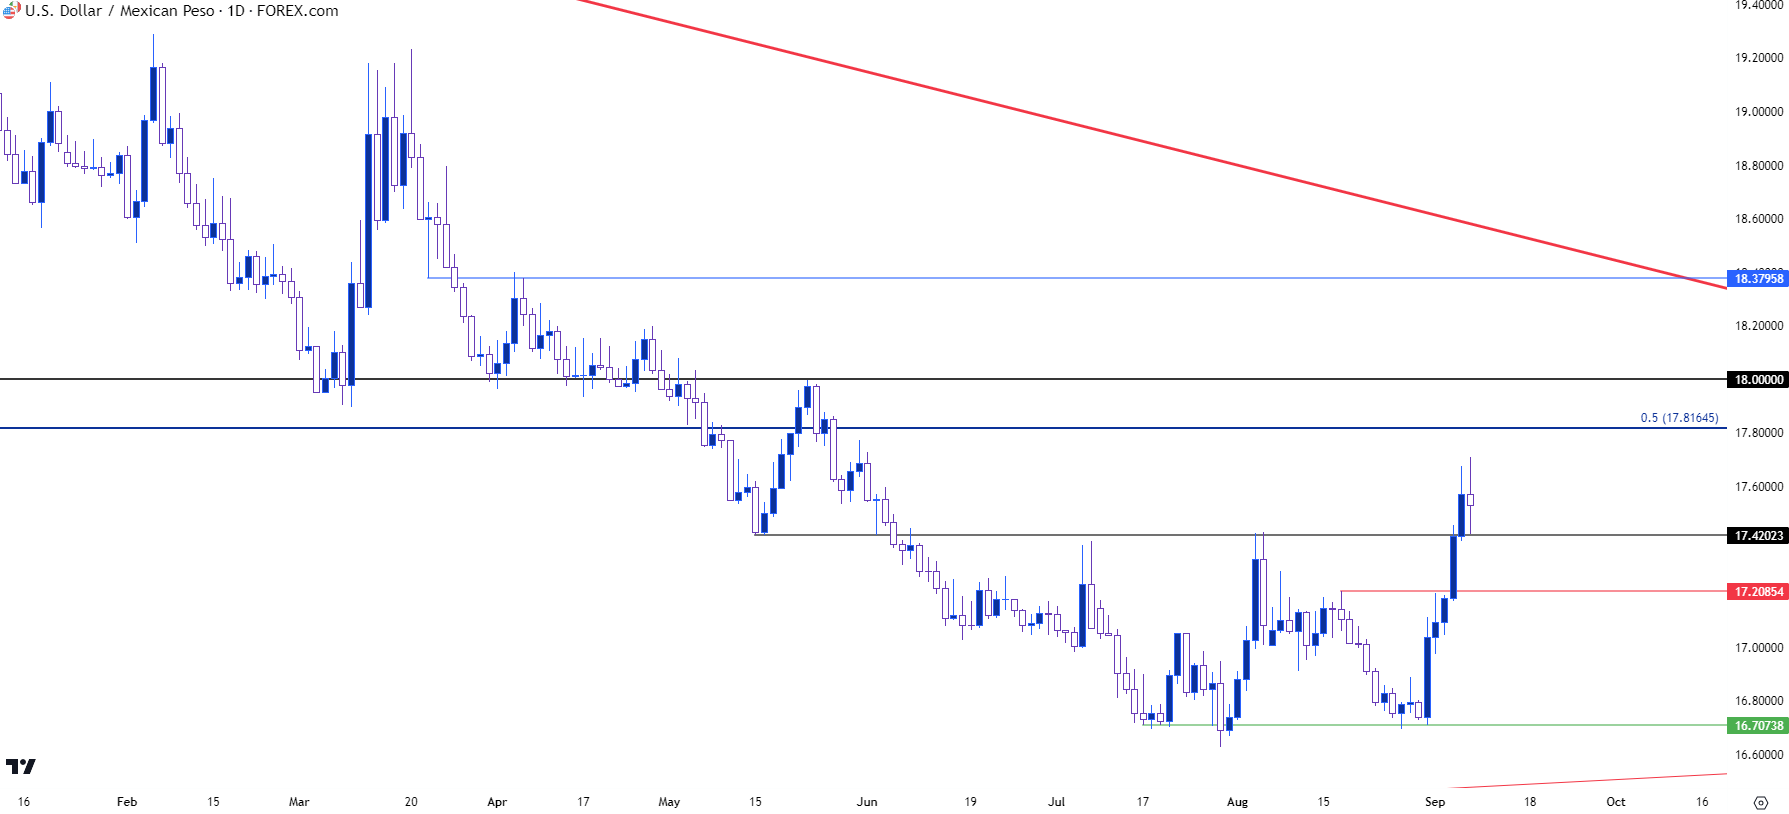
Chart prepared by James Stanley, USD/MXN on Tradingview
--- written by James Stanley, Senior Strategist
Latest market news
Yesterday 01:32 PM
Yesterday 09:35 AM
Yesterday 07:23 AM
Yesterday 04:48 AM
Yesterday 12:17 AM
July 25, 2024 10:39 PM
Latest Trade Ideas and Alerts articles

May 1, 2024 04:50 PM

April 16, 2024 04:24 AM

April 15, 2024 06:08 AM

December 14, 2023 06:06 PM