

Japanese yen takeaways
- The yen is catching a safe haven bid amidst turmoil in the US banking sector.
- Treasury Secretary Yellen’s announcement that the US could hit its debt ceiling in early June is also contributing to USD/JPY weakness.
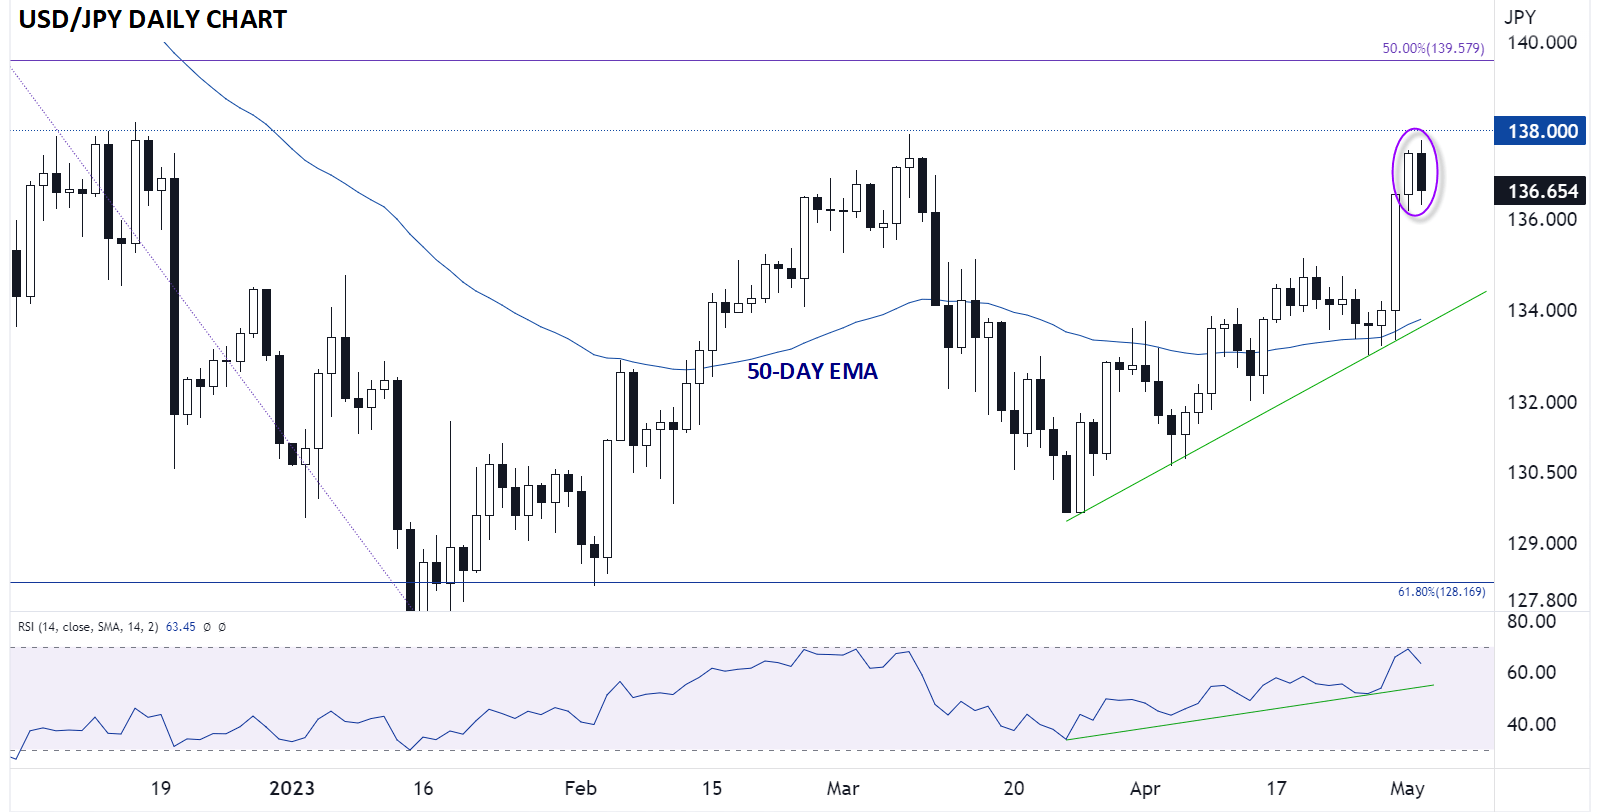
- A dark cloud cover candlestick pattern and bearish RSI divergence could see USD/JPY fall toward 135.00 if the Fed comes off as less hawkish than expected.
With major US indices seeing one of their worst days of the year, we’re seeing a good old-fashioned “risk off” day across all major markets. Usually, this means strength in the world’s reserve currency, but in this case, the source of the market’s concern is US regional banks, so the greenback isn’t flowing to the top of the FX relative strength charts; instead, the “other” major safe haven currency, the Japanese yen, is the big winner today.
Despite moribund monetary policy, seemingly no prospect for an imminent increase in interest rates, and a series of market holidays that will keep Japanese traders away from their desks for the rest of the week, the Japanese yen could be the big beneficiary from a bout of risk aversion stemming from concerns about the US financial system.
In addition to today’s acute worries about the stability of US regional banks, Treasury Secretary Janet Yellen spooked traders yesterday by announcing that the US could hit the limits of the debt ceiling as soon as June 1st, making the long-simmering debt ceiling drama an imminent threat for policymakers. While a last-minute solution will almost certainly be cobbled together as always, it is at least notable that the “last minute” is now much sooner than many had expected 24 hours ago, weighing on the US dollar.
Japanese yen technical analysis: USD/JPY’s bearish reversal
Looking at the daily chart, USD/JPY rallied all the way up to approach its year-to-date highs near 138.00 earlier today before reversing back lower. With only a couple hours left in the “trading day,” the pair is showing a clear dark cloud cover candlestick pattern, signaling a shift from buying to selling pressure and marking a potential near-term top for the pair:
Source: StoneX, TradingView
At the same time, the 14-day RSI is showing a potential bearish divergence with the March highs, showing waning buying pressure. If the Fed fails to deliver a hawkish enough message tomorrow (or even refrains from hiking rates entirely), the selling pressure could pick up heading into the latter half of the week. To the downside, the first target to watch will be previous-resistance-turned-support near 135.00, followed by the rising trend line and 50-day EMA near 134.00.
Only a bullish reversal and break above 138.00 resistance would shift the near-term bias back in favor of the bulls at this point.
-- Written by Matt Weller, Global Head of Research
How to trade with City Index
You can trade with City Index by following these four easy steps:
-
Open an account, or log in if you’re already a customer
• Open an account in the UK
• Open an account in Australia
• Open an account in Singapore
- Search for the market you want to trade in our award-winning platform
- Choose your position and size, and your stop and limit levels
- Place the trade
Latest market news
Yesterday 06:37 AM
April 26, 2024 01:25 PM
April 26, 2024 11:40 AM
Latest JPY articles

April 8, 2024 06:04 AM

March 19, 2024 04:21 AM

February 27, 2024 12:54 AM

January 12, 2024 07:36 PM