

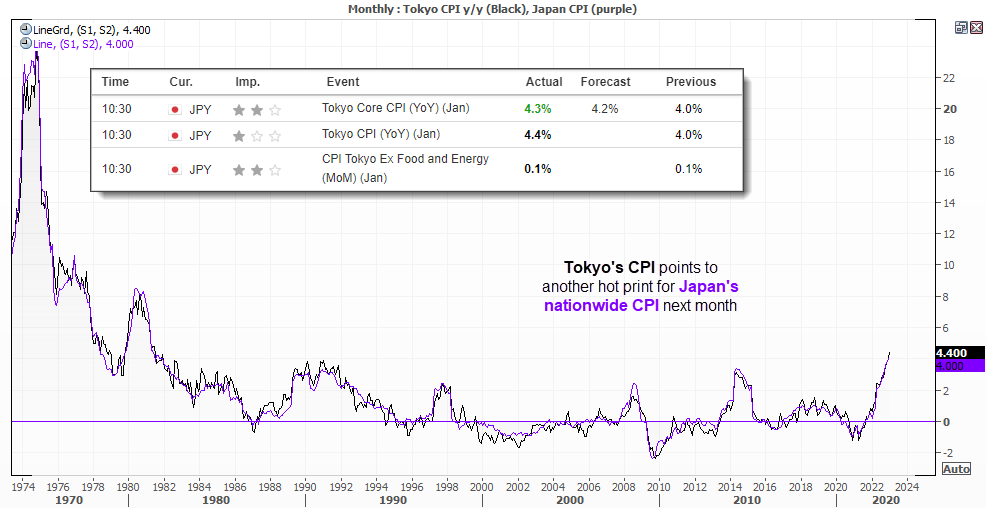
Inflation in Tokyo rose 4.4% y/y in January, its highest level since 1981. And as Tokyo inflation has a tendency to lead nationwide inflation in Japan, it suggests another hot print for Japan’s CPI in February. And that places further pressure on the BOJ to tighten policy from its ultra-easy stance, and explains why JPY is now the strongest major of the session.
However, Kuroda’s defiance and pattern of surprising markets and going against the consensus means we may not get any policy changes at his final meeting in March, and instead leave it to his successor to tighten policy, So whilst USD/JPY is lower today, we still see the potential for it to extend a countertrend move. Especially if the FOMC are more hawkish than expected next week. But a look at the chart also suggest its bearish move from the 2022 high could now have limited downside.
USD/JPY monthly chart:
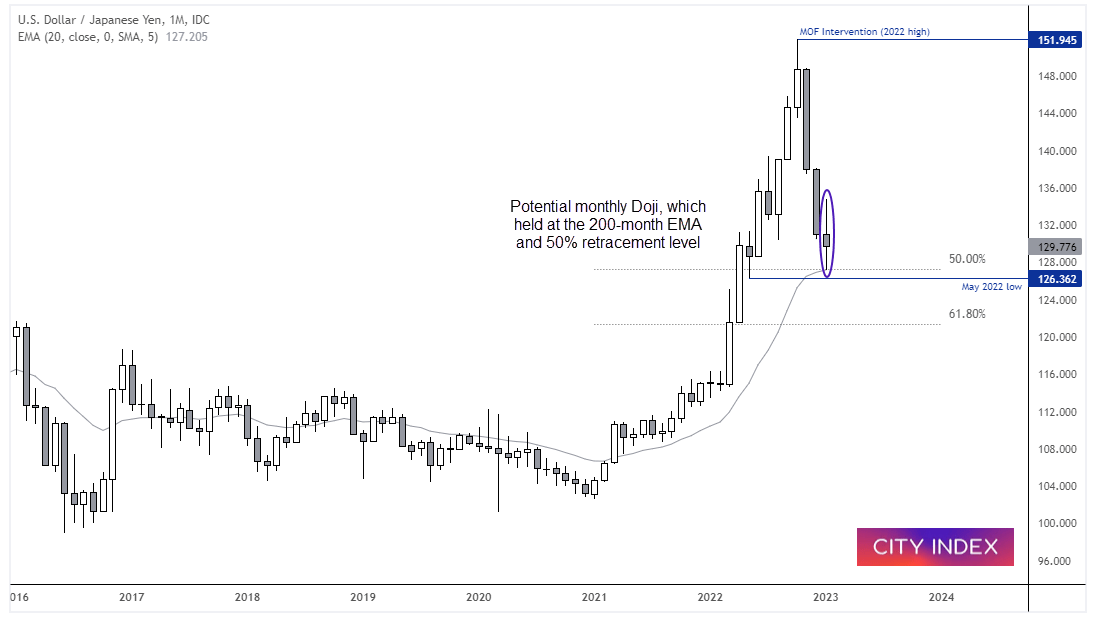
The yen is on track for its third consecutive bearish month, as it continues to retrace against its 21-month bullish rally where the pair rose over 48%. And if it were to close around current levels it would have produced a monthly Doji, which warns of weakness to the bearish move. Furthermore, this month’s low perfectly respected the 200-month EMA and 50% retracement level as support. And that begs the question as to whether we have seen an important swing low.
USD/JPY weekly chart:
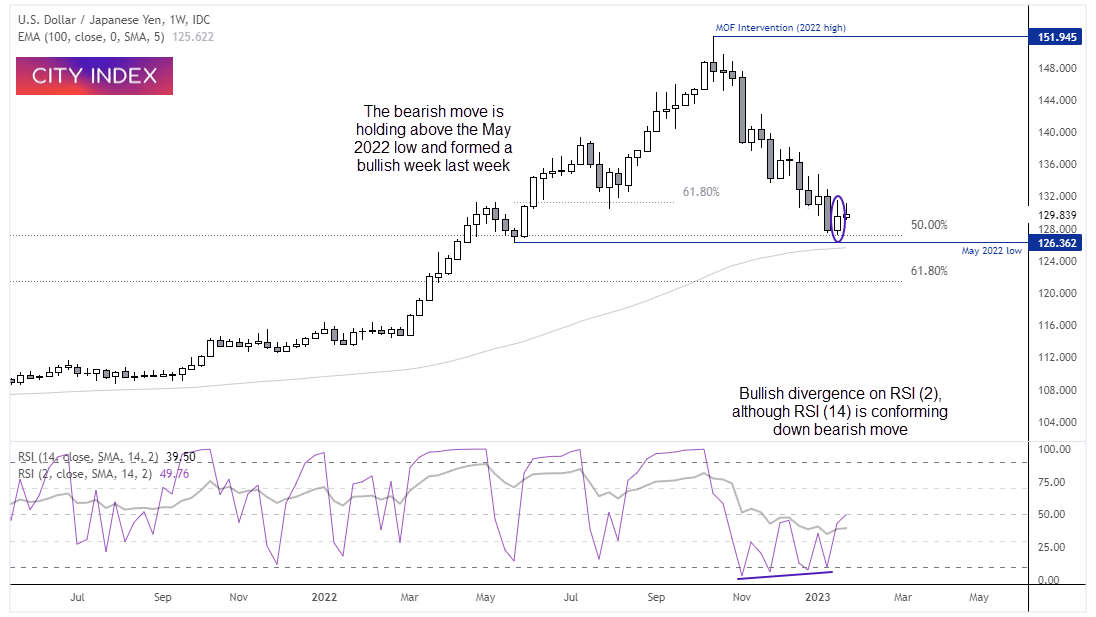
The weekly chart shows how the decline from the 2022 high is holding above the May 2022 low, and a bullish divergence is forming on RSI (2), to warn of near-term exhaustion to the downside. Yet as the RSI (14) remains below 50 and tracks prices lower without a bullish divergence, we’re on guard for a bounce higher with the potential to also break to new low further out.
USD/JPY daily chart:
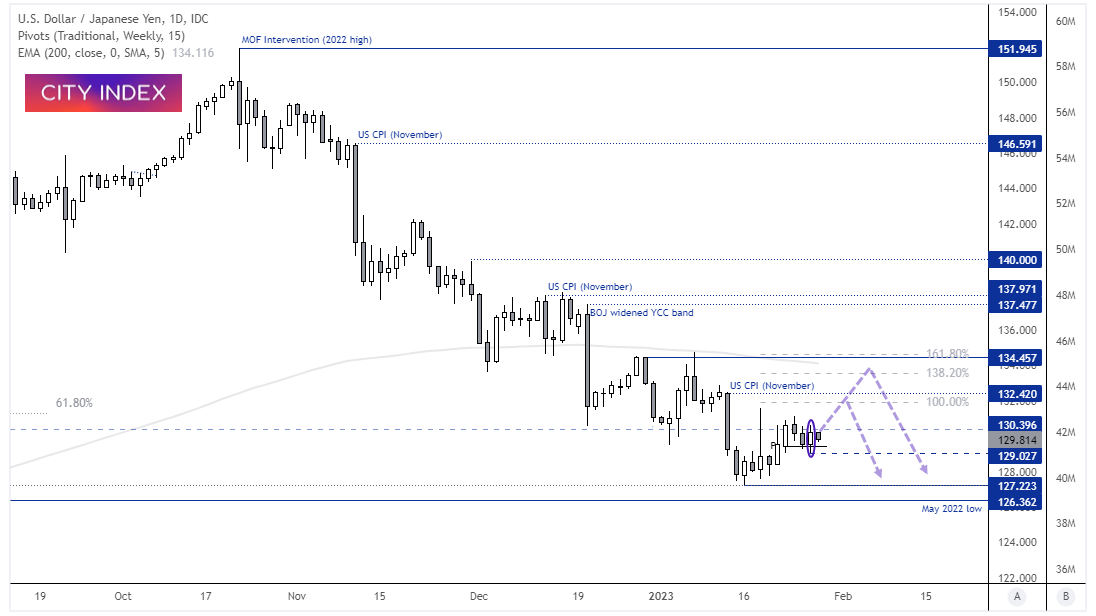
The daily chart shows an initial countertrend rally from 127.23 low briefly rose above the August low, but has since pulled back. A bullish outside day formed yesterday to suggest a swing low may have formed just above 129, and prices are pulling back within yesterday’s range – yet holding above the weekly pivot point. We’re now looking for another leg higher on the daily chart as part of its countertrend move. Whether this is simply a last leg higher of an ABC correction or something bigger remains to be seen, but overall shorting USD/JPY is not a new idea and the higher timeframes suggest the downside potential is limited.
- Over the near-term, the bias remains bullish above yesterday’s low and for a move to 132 (just below the 100% projection / wave equality).
- If the Fed are more hawkish than expected at next week’s meeting, 134 becomes a viable target near the 200-day EMA, in between the 138.2% and 161.8% Fibonacci projections.
- Over the medium-term, perhaps we could even see it return to 140 if prices remain above 127.22 (or the May 2022 low).
Latest market news
Yesterday 01:32 PM
Yesterday 09:35 AM
Yesterday 07:23 AM
Yesterday 04:48 AM
Yesterday 12:17 AM
July 25, 2024 10:39 PM
Latest Trade Ideas articles

Yesterday 09:35 AM

Yesterday 12:17 AM

July 25, 2024 10:39 PM

July 25, 2024 05:30 PM