May 10, 2022 4:14 PM
Although the US Dollar Index reached its highest level yesterday since December 2002 at 104.18, the DXY has been consolidating near the 2017 highs at 103.82 since April 28th. This has allowed for the RSI on the daily timeframe to pullback into neutral territory after the index galloped higher from near 100 on April 21st to the 103.82 level. If the DXY does breakout of the consolidation area, the next resistance level isn’t until 105.41, which is horizontal resistance from September 2002. Support is at the May 5th low of 102.35. Notice in the bottom panel of the chart that the correlation coefficient between the DXY and USD/CHF is +0.95. A correlation coefficient of +1.00 means that there is a perfect position correlation between the 2 assets. A reading of +0.95 if pretty close! Therefore, if one does not have access to trade the DXY, USD/CHF may be used as a proxy.
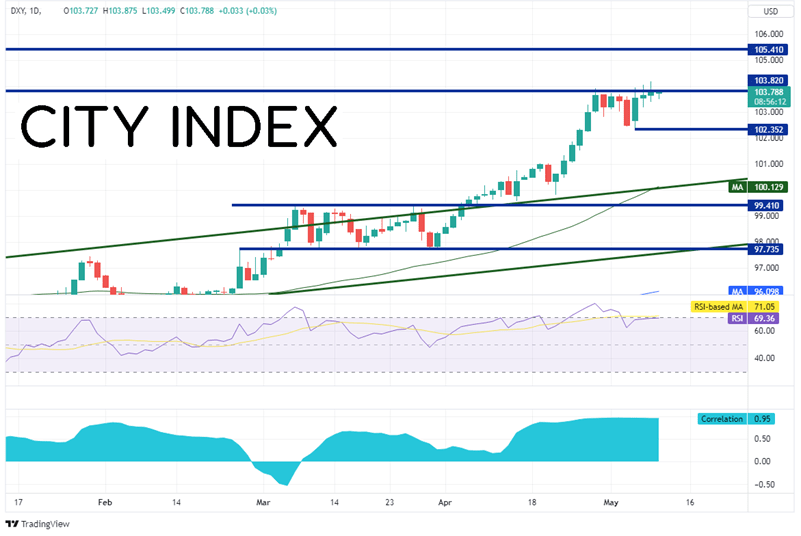
Source: Tradingview, Stone X
On a weekly timeframe, USD/CHF had moved lower from a high of 1.0226 in May 2019 to a low of 0.8757 in January 2021. As markets began talking about inflation in the US and the possibility of raising rates, USD/CHF began to rise. Note that the SNB lowered interest rates to -0.75 during the pandemic, and they remain at the ultra-low level. Price action in the pair began forming a rising triangle over the course of the next year, with a horizontal top trendline at 0.9472. The target for the breakout from a rising triangle is the height of triangle added to the breakout point. In this case the target is near 1.0175. USD/CHF broke above the top trendline of the triangle on April 19th and price hasn’t look back. However, is the pair ready for a consolidation of its own, or even a pullback as price approaches 1.00? Notice that the RSI on the weekly chart is in overbought territory, an indication that price may be ready for a correction.
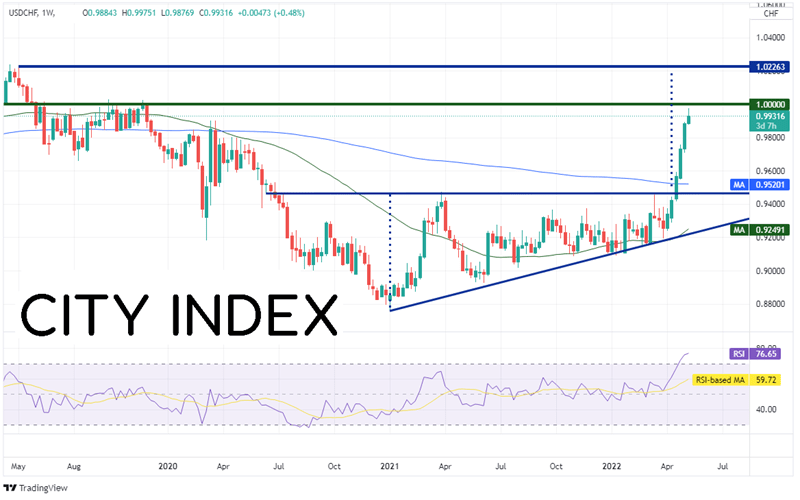
Source: Tradingview, Stone X
Trade USD/CHF now: Login or Open a new account!
• Open an account in the UK
• Open an account in Australia
• Open an account in Singapore
The daily timeframe provides a clearer picture of just how strong the move has been in USD/CHF since April 19th as the pair appears to be pausing just below parity, which now acts as key psychological round number resistance. Above there, price can move up to the previously mentioned highs from May 2019 at 1.0226. However, notice that the RSI is also overbought on the daily timeframe as well. If price does pull back, intra-day support is at 0.9800, then the lows from May 5th at 0.9709. Below there, USD/CHF can move back to the horizontal breakout point of 0.9439.
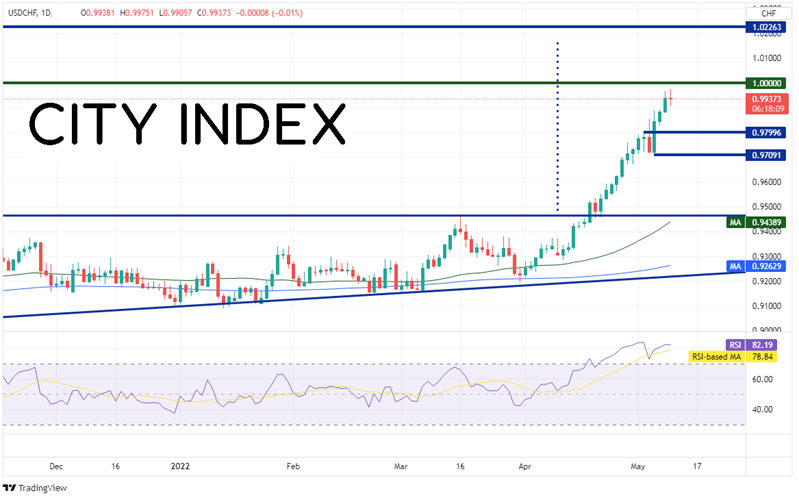
Source: Tradingview, Stone X
The US Dollar Index (DXY) and USD/CHF have a very strong positive correlation. As the DXY pauses at its highest level in nearly 20 year, USD/CHF has halted just under 1.00. Will USD/CHF continue higher towards its target from the breakout of the rising triangle? Breaking through parity will play a big part in determining that, however, so will the next direction of the US Dollar Index.
Learn more about forex trading opportunities.
Latest market news
Yesterday 01:32 PM
Yesterday 09:35 AM
Yesterday 07:23 AM
Yesterday 04:48 AM
Yesterday 12:17 AM
July 25, 2024 10:39 PM
Latest Forex articles

Yesterday 12:17 AM

July 25, 2024 10:39 PM

July 25, 2024 03:59 PM

July 25, 2024 04:37 AM