February 3, 2021 2:06 PM
Is it time for bears to step in USD/JPY?
USD/JPY has been moving lower since 2015! On a daily timeframe though, the pair has been in a descending wedge since mid-summer 2020. However, on January 29th, USD/JPY broke out of the top of the wedge and moved up to the 161.8% Fibonacci extension from the highs on January 12th to the lows on January 21st. Horizontal resistance also crosses near that area. The pair has also moved up for 6 days in a row, and over the last 3 days the ranges have been getting smaller and smaller.
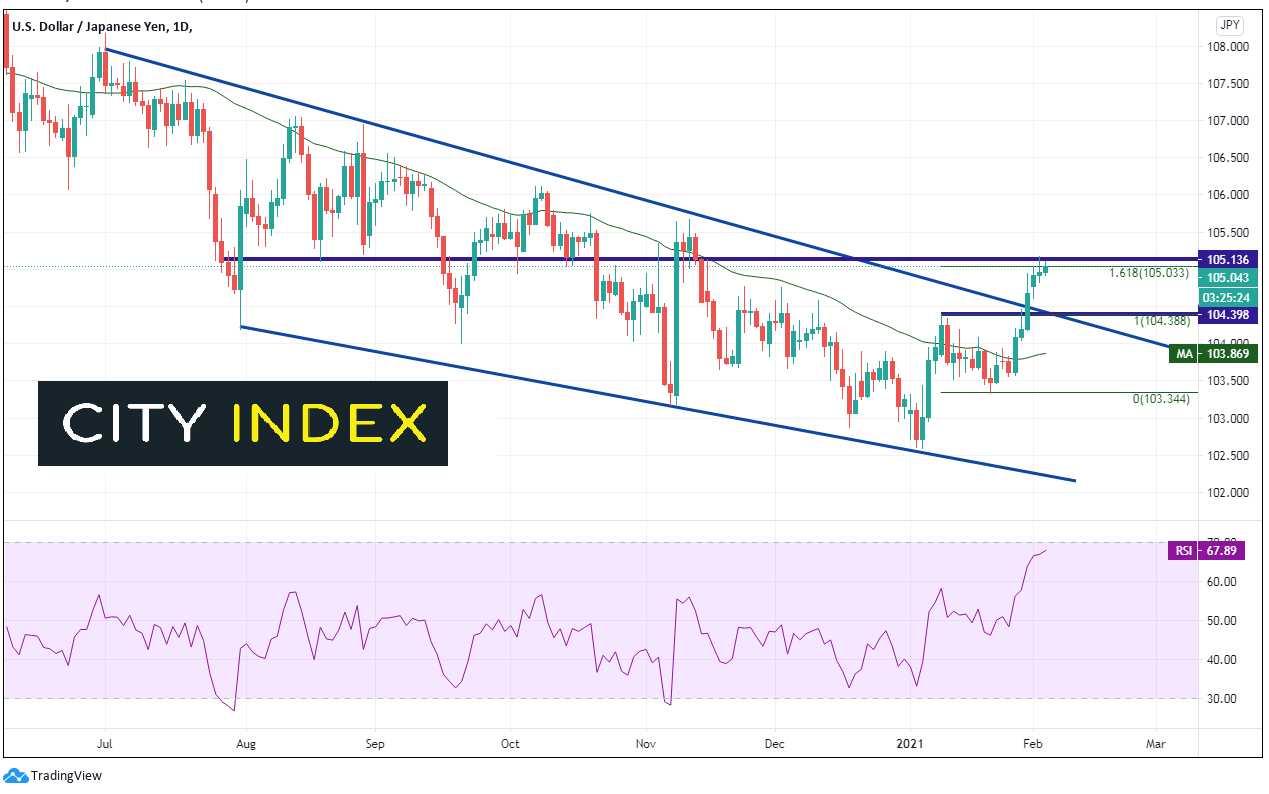
Source: Tradingview, City Index
On a 240-minute timeframe, USD/JPY had been moving in a smaller descending triangle of its own and broke out on January 7th , only to form a flag pattern (red). The pair reached the target at horizontal resistance and crept higher to the previously mentioned 161.8% Fibonacci extension. The RSI is diverging with price from overbought conditions.
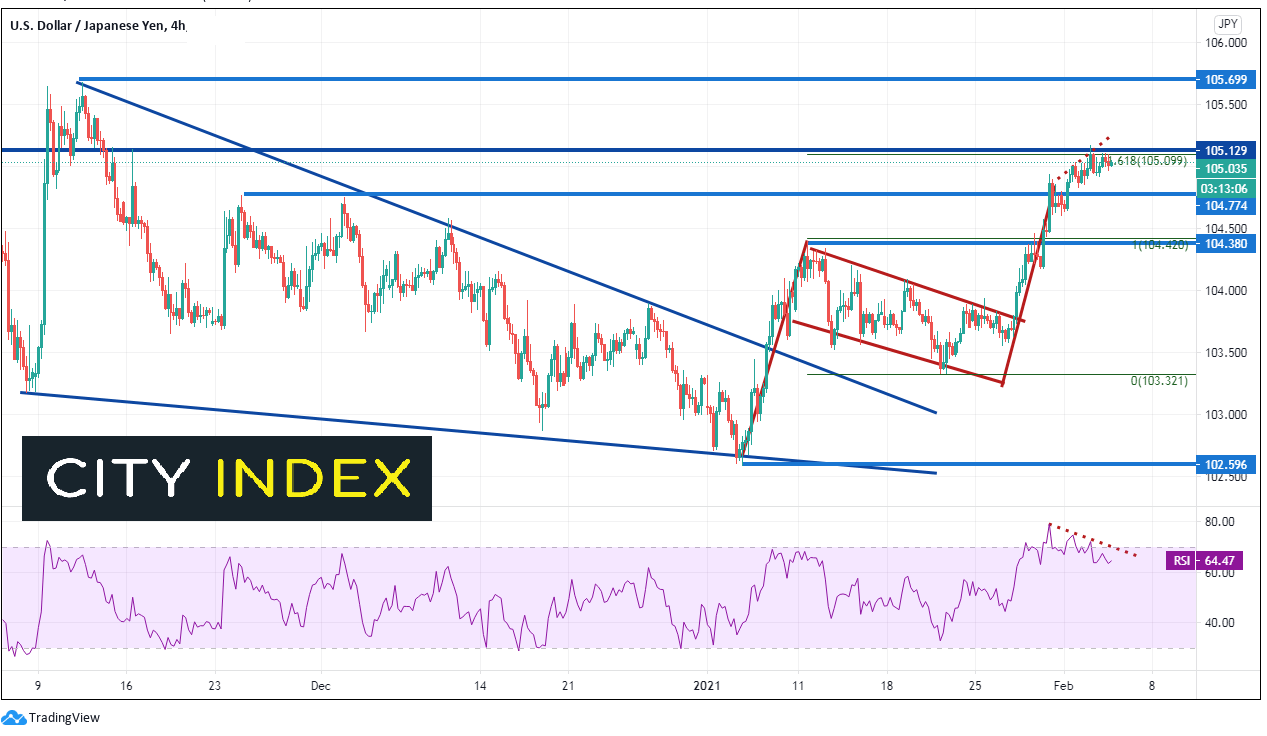
Source: Tradingview, City Index
The 60-minute timeframe shows price breaking lower from an ascending wedge as well, which targets 104.45.
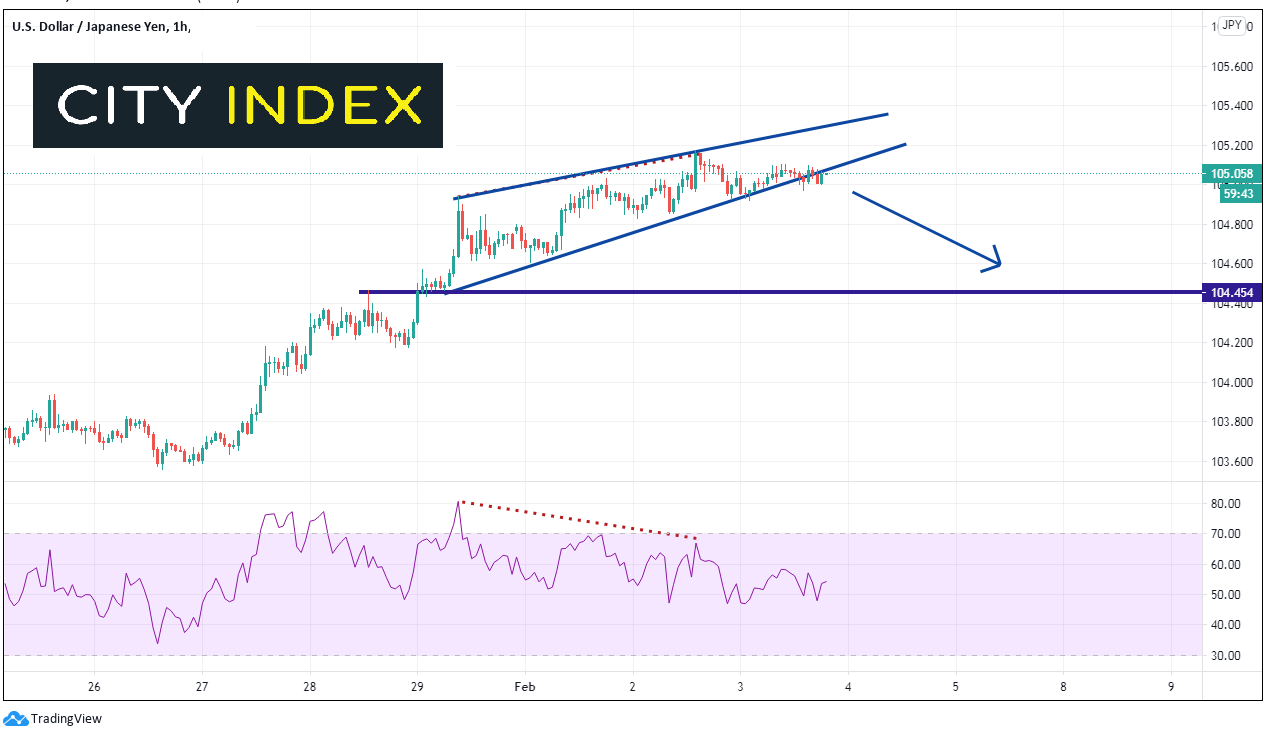
Source: Tradingview, City Index
Bears will be looking to take advantage of the horizontal resistance, 161.8% Fibonacci extension and the diverging RSI to sell USD/JPY above 105.00, with a potential target of horizontal support and the top downward sloping trendline of the descending wedge on the daily timeframe, near 104.35/45. Stops could potentially be placed above the horizontal resistance near 105.25.
USD/JPY has been moving higher since January 21st, however at near-term resistance, it may be time for bears to step in.
Learn more about forex trading opportunities.
Everything you should know about the Japanese Yen (JPY)
Latest market news
Yesterday 01:32 PM
Yesterday 09:35 AM
Yesterday 07:23 AM
Yesterday 04:48 AM
Yesterday 12:17 AM
July 25, 2024 10:39 PM
Latest Forex articles

Yesterday 12:17 AM

July 25, 2024 10:39 PM

July 25, 2024 03:59 PM

July 25, 2024 04:37 AM