

This is an excerpt from our full Indices 2024 Outlook report, one of nine detailed reports about what to expect in the coming year. Click the banner at the bottom to download the full report.
SPX for 2024 – ATH into 5,000
The S&P 500 has held up well through this hiking cycle, all factors considered. After retracing 50% of the major move that sprung from the lows of the pandemic as rate hikes were pricing in during 2022, bulls have been able to hold the reins for much of the past year. The banking crisis that showed up in March served as a boost for the risk trade, and then Chair Powell’s appearance at November and December FOMC rate decisions helped to reinvigorate buyers in late-year price action. This was driven by the thought that the Fed was complete with rate hikes and that the next move would be a cut.
From the weekly chart below there’s just one point of resistance left before fresh all-time highs come into the picture, and that’s the 4818 level that was traded in the opening days of 2022. Above that, the psychological level of 5,000 lurks above and that would seem like a logical next spot of resistance, and a level of that nature may even create a pullback type of scenario given that it’s never traded before.
Above the 5,000 level, there’s a Fibonacci extension that plots at 5,180, which is approximately 9.5% away from current price; and this would be the next topside area to investigate for resistance beyond the big figure.
SPX Weekly Chart (Logarithmic)
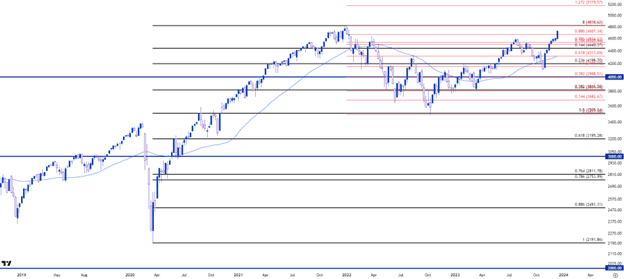
Chart prepared by James Stanley; data derived from Tradingview
Nasdaq
While it’s been a strong year for the SPX, it’s been an even stronger outing for the Nasdaq which is working on its largest annual gain since 2009 with a gain of more than 50%. That’s a massive trend by any measure, and it can be simple to look at a scenario of that nature and assume some element of mean reversion to follow. But, like the weekly chart above of the SPX, there is little sign of bulls letting up and there remains bullish breakout potential as driven by the excitement of softer monetary policy.
Given that greater incline, there could be more vulnerability to pullback themes, such as we saw during 2022 trade and like pullbacks in 2018-2019 and 2020; but each of those turned out to be significant buying opportunities for bulls and there could be a similar backdrop in the event of a sell-off in stocks in 2024 as rate cuts begin.
The current all-time high already appears vulnerable and this may soon be taken out. Beyond that, the 17,500 level would be a natural resting place for follow-through resistance, but it’s the 127.2% Fibonacci extension of the pullback move that plots just below 18,500 that sticks out. That’s 11% away from current price, while the 161.8% extension of that move is all the way up at 20,673, or 24% away. If the breakout takes hold in the way that the trend traded, particularly in Q4 of this year, those levels could be attainable targets for bulls.
NDX Monthly Chart (Logarithmic)
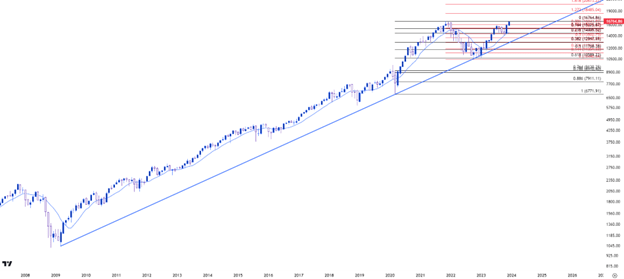
Chart prepared by James Stanley; data derived from Tradingview
What are the major fundamental stories to watch on indices next year? What about the Dow and DAX? See our full guide to explore these themes and more!

Latest market news
Yesterday 01:32 PM
Yesterday 09:35 AM
Yesterday 07:23 AM
Yesterday 04:48 AM
Yesterday 12:17 AM
July 25, 2024 10:39 PM
Latest US SP 500 articles


July 11, 2024 07:45 PM

June 18, 2024 01:57 PM

May 24, 2024 11:52 AM