

China are expected to release their trade data today, although two hours since the scheduled time has past so it could drop any moment now (or not…). Both imports and exports are expected to have grown at a softer pace in May, due to lower demand and coronavirus curbs. But it could impact forecasts for Friday’s GDP report, so the sooner it arrives the netter.
Over the past few weeks we have seen PMI data expand at a faster pace than expected. Both the NBS and Caixin reports suggest the services and manufacturing sectors expanded in June. Yet factory gates fell to a 15-month low and consumer prices hit a 23-month high, as the two inflation reads continue to converge. Producer prices (an input to consumer inflation) fell to 6.1%, down from a peak of 13.5% in Q4 whilst consumer prices rose 2.5% y/y.
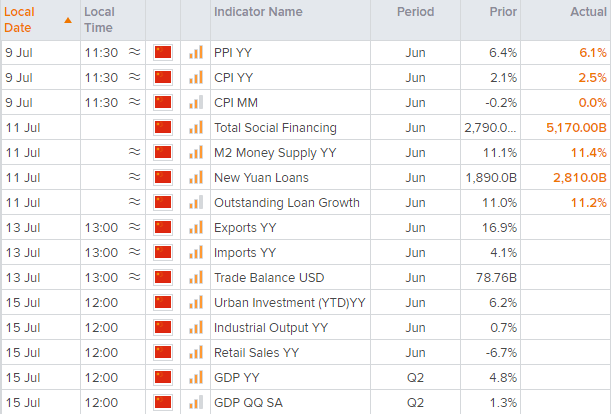
A spokesman for the General Administration of Customs warned today that foreign trade still faces instabilities and uncertain factors. But overall, officials believe stable growth can still be achieved via foreign thanks to government support. And we get to see if that is the case with Friday’s GDP report for Q2, although lockdowns across parts of China are more than likely to have weighed on growth overall.
Whilst banking loans saw a notable rise in July thanks to further policy support, that will only go so far if global demand drops. Slower global demand is likely to continue to weigh on China’s exports over the foreseeable future. And that’s another headwind for GDP, particularly as we head towards Q4 and Q1 2023.
China A50 4-hour chart:
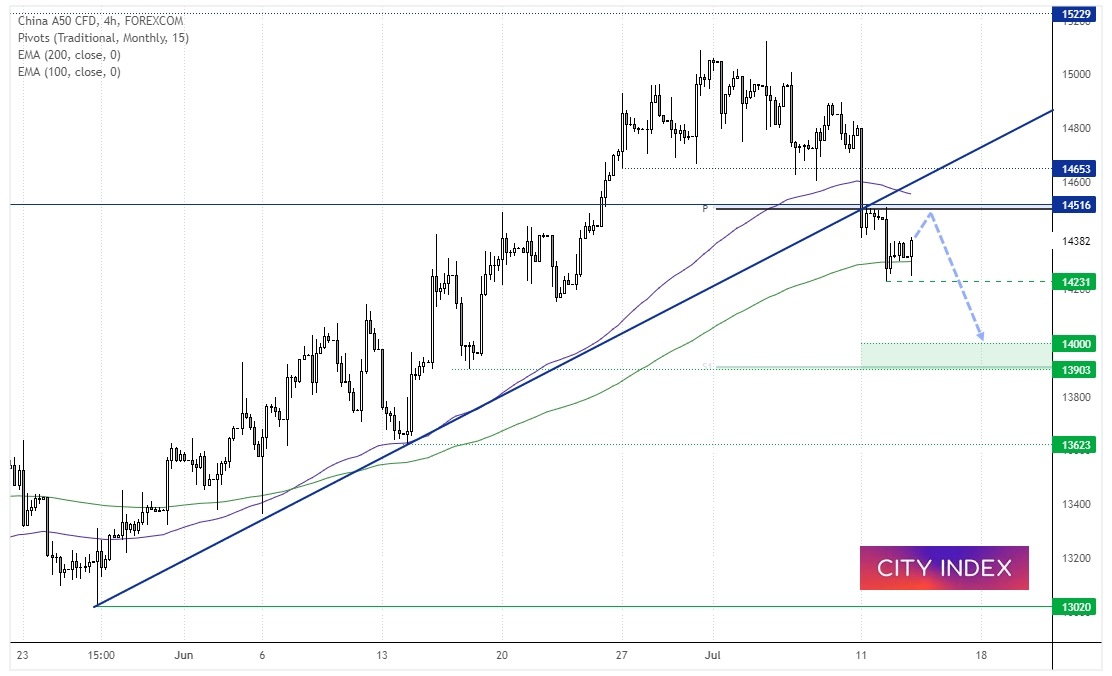
The China A50 broke beneath its bullish trendline and monthly pivot point. Prices are now forming a potential bear flag, although support has been found around the 200-bar eMA on the 4-hour chart.
A break of yesterday’s low brings the support zone around 14,000 into focus. The bias remains bearish beneath the monthly pivot point (P) so we could also consider short setups below that level if prices move higher.
Hang Seng Index
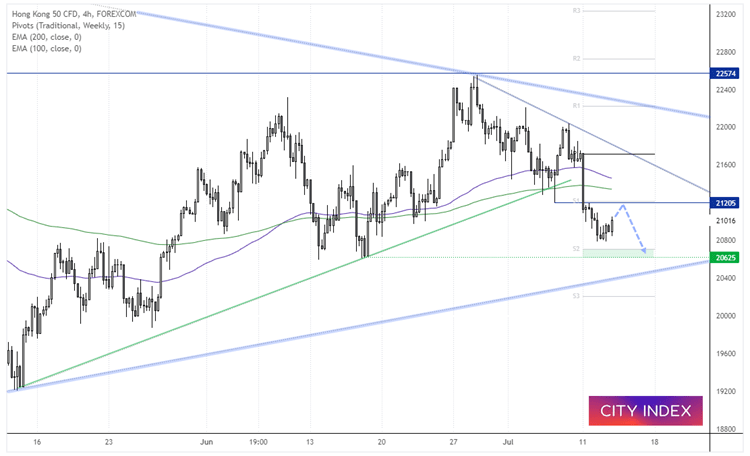
As mentioned in last week’s report, the Hang Seng was coiling up between two trendlines which suggested it is headed towards a period of volatility. We can see on the 4-hour chart that, whilst prices remain within the larger triangle, the bullish trendline within the triangle has been broken.
A bearish trend on the 4-hour chart found support around 20,800 / monthly S1 support. Prices are now retracing but we see the potential for another leg lower whilst prices remain beneath 21,200. Potential support zones that bears may target include the 20,6025 low and lower bullish trendline.
How to trade with City Index
You can easily trade with City Index by using these four easy steps:
-
Open an account, or log in if you’re already a customer
• Open an account in the UK
• Open an account in Australia
• Open an account in Singapore
- Search for the company you want to trade in our award-winning platform
- Choose your position and size, and your stop and limit levels
- Place the trade
Latest market news
Yesterday 01:32 PM
Yesterday 09:35 AM
Yesterday 07:23 AM
Yesterday 04:48 AM
Yesterday 12:17 AM
July 25, 2024 10:39 PM
Latest Technical Analysis articles

July 25, 2024 03:59 PM

July 24, 2024 07:26 PM

July 24, 2024 09:55 AM

July 23, 2024 11:58 AM