

Asian Indices:
- Australia's ASX 200 index fell by -52.2 points (-0.73%) and currently trades at 7,053.70
- Japan's Nikkei 225 index has fallen by -275.96 points (-0.82%) and currently trades at 33,243.74
- Hong Kong's Hang Seng index has fallen by -299.4 points (-1.66%) and currently trades at 17,779.60
- China's A50 Index has fallen by -106.78 points (-0.88%) and currently trades at 11,969.62
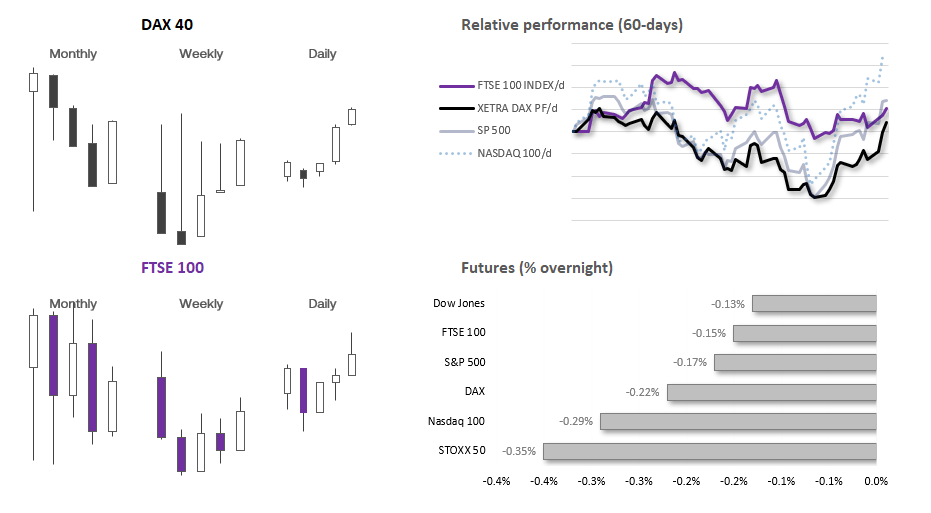
UK and European indices:
- UK's FTSE 100 futures are currently down -17 points (-0.23%), the cash market is currently estimated to open at 7,469.91
- Euro STOXX 50 futures are currently down -18 points (-0.42%), the cash market is currently estimated to open at 4,297.53
- Germany's DAX futures are currently down -44 points (-0.28%), the cash market is currently estimated to open at 15,704.17
US index futures:
- DJI futures are currently down -58 points (-0.17%)
- S&P 500 futures are currently down -10 points (-0.22%)
- Nasdaq 100 futures are currently down -51.25 points (-0.32%)
The Australian jobs report continues to knock out decent numbers by historical standard, although today’s data set does little to move the dial for the RBA. The central bank will be forced to keep their hawkish bias with an unemployment rate rising to a mere 3.7%, participation rate just of fits record highs at 66.7% with 55k jobs added.
With AUD/USD having risen sharply after the US inflation report, mean reversion kicked in. The combination of decent but not amazing employment figures and softer China house prices weighed on sentiment to send the Aussie to a 2-day low.
We’re seeing sentiment retrace against US-CPI hype, with stock future indices slightly lower ahead of the open NZD and AUD are the weakest forex majors.
We have a host of Fed speakers lined up today. However, the October inflation figures seriously undermined hawkish comments Powell made ahead of the release, proving that data remains more powerful than words. With all headline figures below estimates, it will be hard for traders to take notice any verbal pushback from the Fed regarding rates unless incoming data points the wrong way.
Events in focus (GMT):
- 07:00 – German Buba Wuermeling Speaks
- 11:00 – Fed Cook speaks
- 13:30 – US jobless claims, Philadelphia Fed manufacturing
- 14:15 – US industrial production, capacity utilisation, manufacturing production
- 14:25 – FOMC Member Williams Speaks
- 15:00 – Fed Governor Kroszner Speaks
- 15:30 – Fed Waller speaks
- 15:35 – Fed Barr speaks
- 15:45 – MPC member Ramsden speaks
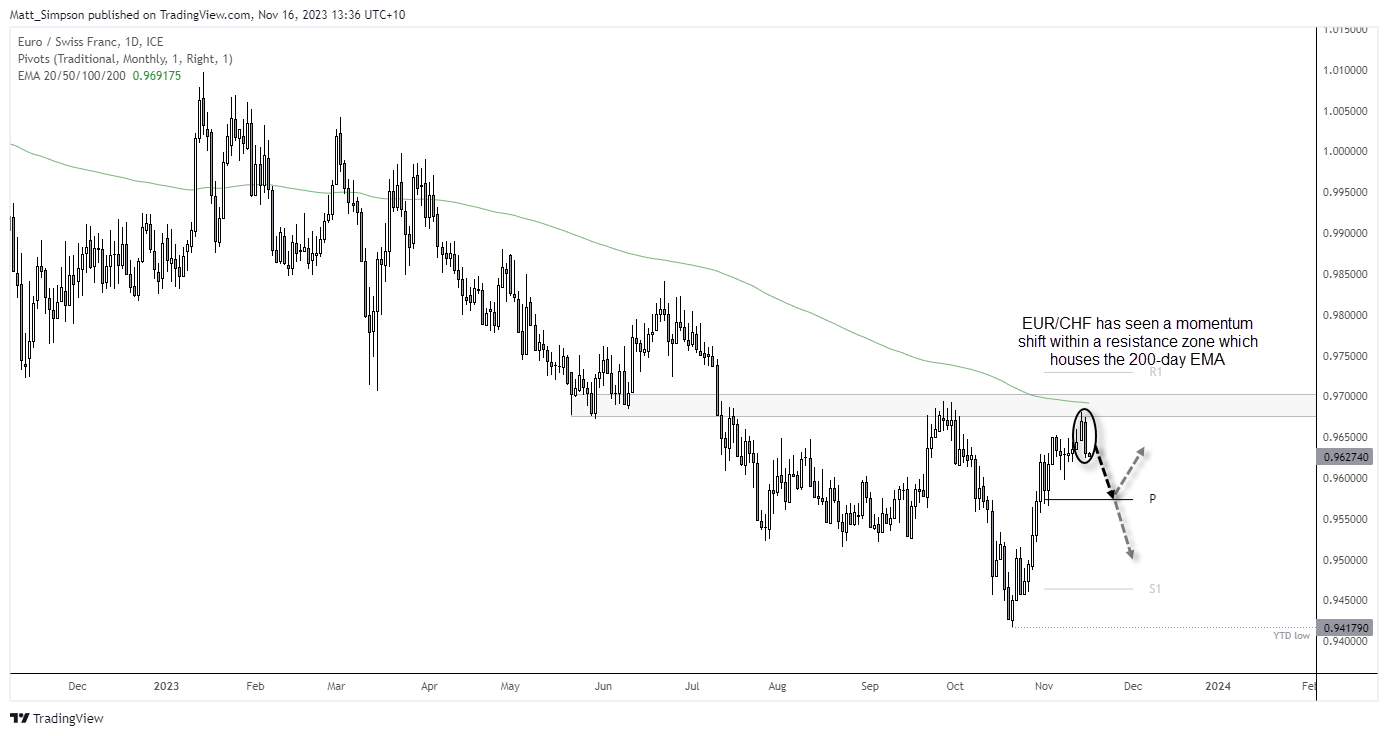
EUR/CHF technical analysis (daily chart):
EUR/CHF has rose nearly 2.8% since its October low but is showing signs of a potential bearish reversal. At least over the near-term. A large bearish candle formed yesterday, which suggests Tuesday’s high is the swing high and lower high. The rally also paused beneath its 200-day EMA and resistance zone (that also provided support back in May and early July. With momentum trying to realign itself with its bearish daily trend, I suspect the cross could at least retrace further from current levels. What makes me question just how deep is the fact that the prior rally is quite deep relative to the prior fall (which is not what you usually see during downtrends. Still, EUR/CHF is trying to turn lower from a key resistance zone, meaning the path of resistance appears lower over the near-term.
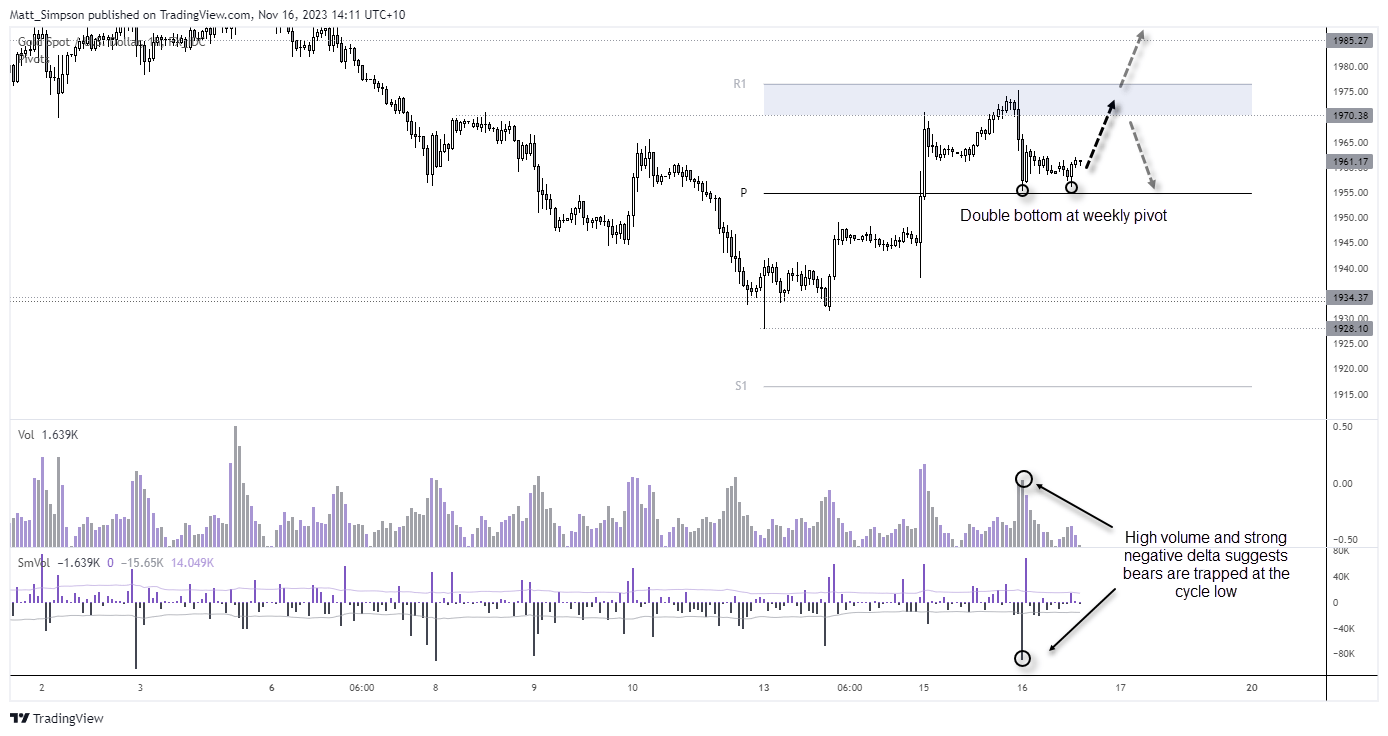
Gold technical analysis (1-hour chart):
Gold’s strong rebound form its 200-day average gives bulls the upper hand over the near-term, so we prefer to buy dips above 1940 for a potential move to the 1985 – 2000 range.
Yet gold’s volatility has receded following the excitement after the US inflation report, and it looks quite comfortable around 1960 despite the US dollar’s cute attempt to recoup some of its inflation-report losses.
The 1-hour chart shows a double bottom has formed just above the weekly pivot point, and that the initial drive lower to 1955 support was on high volume and strong negative delta (more sellers than buyers). The fact that prices have since failed to test that low suggests bears are currently trapped, so if prices fail to break lower today then we could assume at least some of these bears will have to cover and help send prices higher.
I’m not seeking any heroic moves given yesterday was a bearish hammer, but an initial move to 1965 or even 1970 seems feasible as long as prices remain above 1954.5.
View the full economic calendar
-- Written by Matt Simpson
Follow Matt on Twitter @cLeverEdge
How to trade with City Index
You can trade with City Index by following these four easy steps:
-
Open an account, or log in if you’re already a customer
• Open an account in the UK
• Open an account in Australia
• Open an account in Singapore
- Search for the market you want to trade in our award-winning platform
- Choose your position and size, and your stop and limit levels
- Place the trade
Latest market news
Yesterday 01:32 PM
Yesterday 09:35 AM
Yesterday 07:23 AM
Yesterday 04:48 AM
Yesterday 12:17 AM
July 25, 2024 10:39 PM
Latest Trade Ideas articles

Yesterday 09:35 AM

Yesterday 12:17 AM

July 25, 2024 10:39 PM

July 25, 2024 05:30 PM