December 1, 2021 5:12 PM

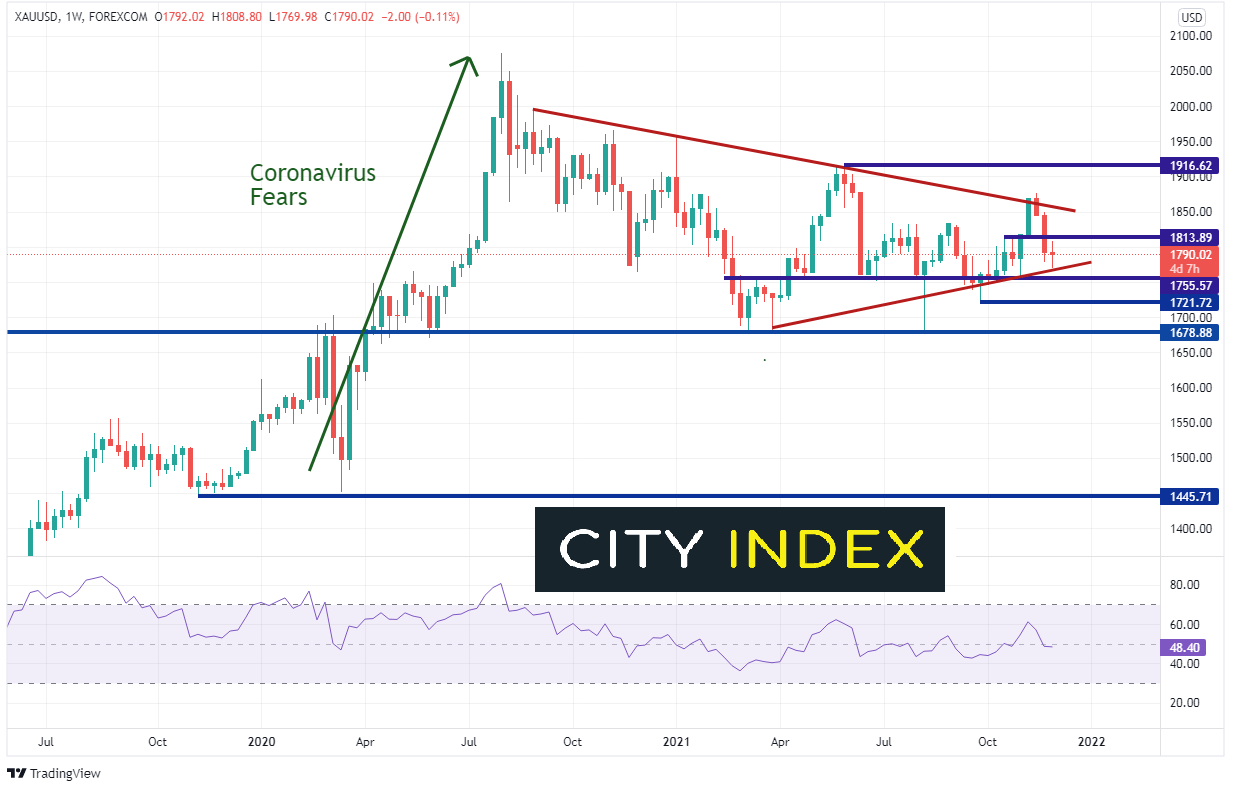
Over time, Gold (XAU/USD) has been considered a hedge to rising inflation. And although that may be true over the course of the long-term, its not always true in the short term. As inflation rises, Gold tends to rise as well. However, the price of Gold in the short term tends to move on inflation expectations, rather than the headline inflation. In addition, the injection of headlines into the news also causes Gold to move (just as with many other instruments). Over the last 22 months, the consistent headlines that have been moving the price of Gold has obviously been the coronavirus. When a new mutation of the coronavirus is discovered or the number of new cases is rising, the price of Gold will rise (negative headlines). When vaccination rates rise, the price of Gold may fall.
On March 20, 2020, Gold began moving higher off support as fear gripped the markets with the emergence of the coronavirus. Gold was truly a flight to safety for the next four and a half months. During the week of August 3rd, 2020, price printed a new, all-time high of 2075.11, a move of nearly 43%! At the time, central banks were pumping the world with stimulus, as they waited for positive news on the virus. The RSI moved into overbought territory; the Gold pulled back into a consolidation triangle.
Source: Tradingview, Stone X
Trade Gold (XAU/USD) now: Login or Open a new account!
• Open an account in the UK
• Open an account in Australia
• Open an account in Singapore
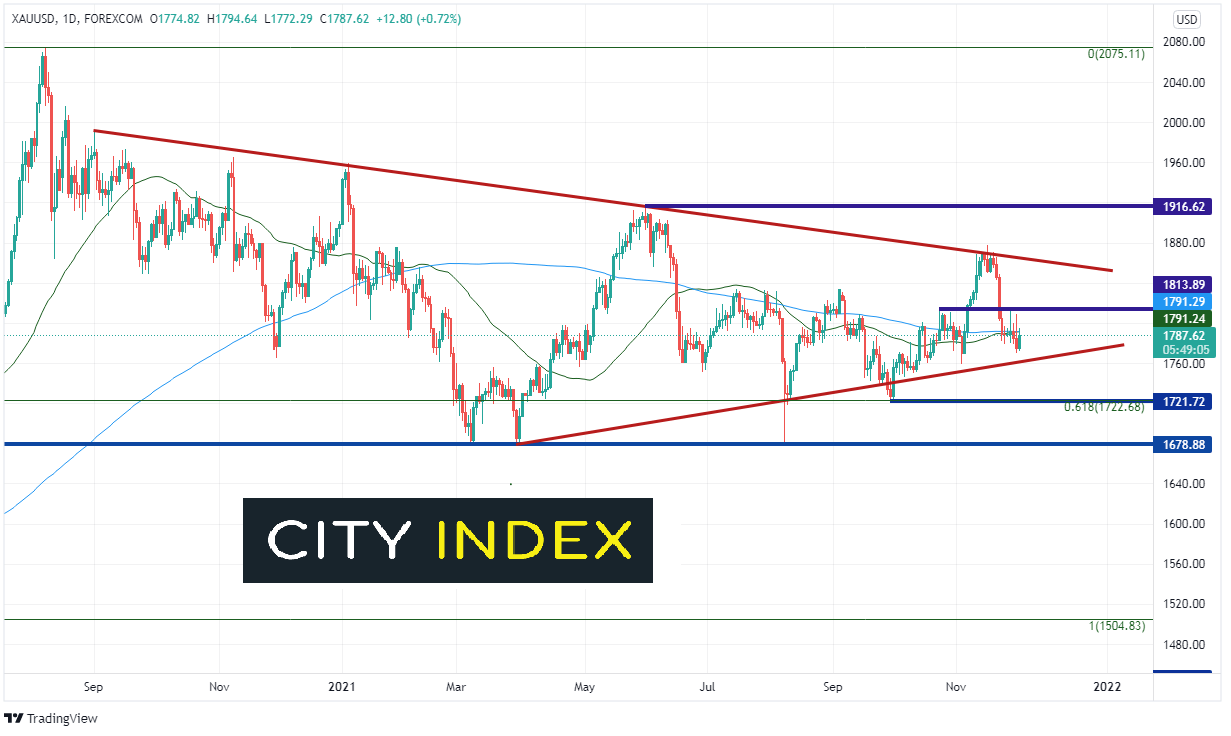
The price of Gold pulled back to 61.8% Fibonacci retracement level from the March 2020 lows to the August 2020 highs at 1722.68 and has briefly spiked below it 3 times since then. The precious metal has been consolidating in a corrective triangle since the all-time highs and is currently approaching the apex of the triangle.
Source: Tradingview, Stone X
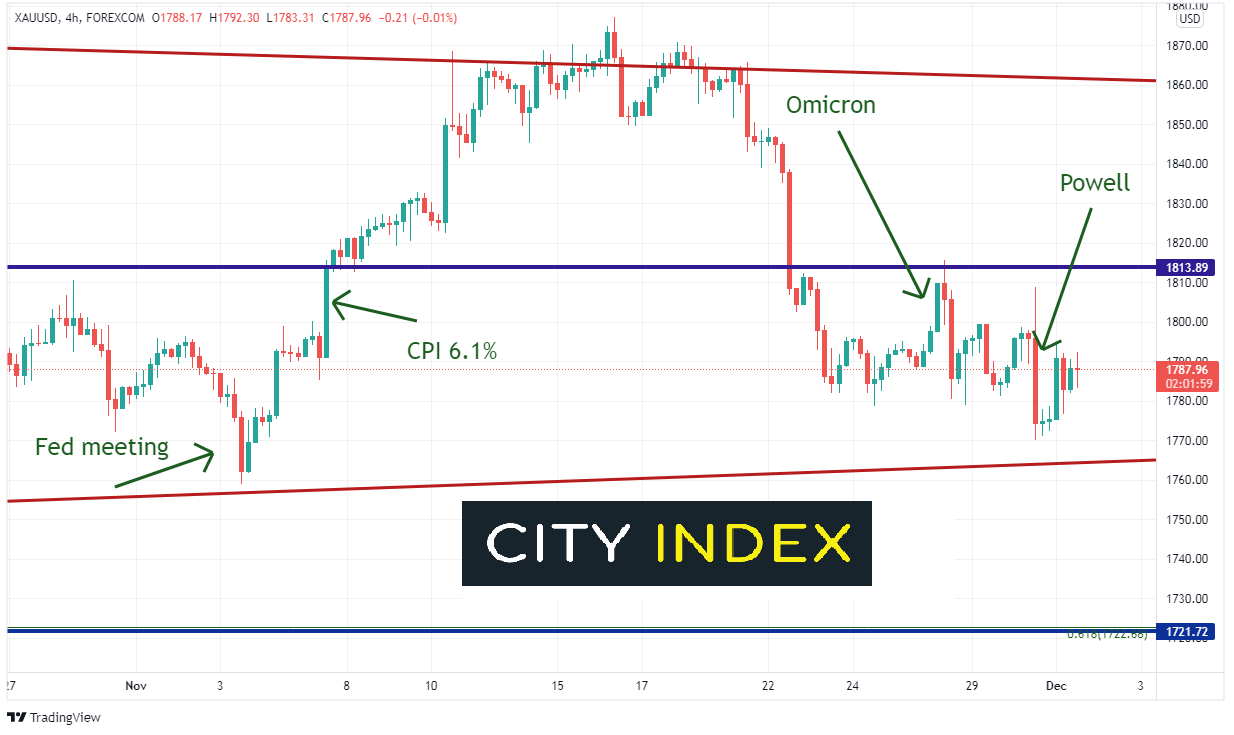
On the 240-minute timeframe, Gold put in a low near the bottom trendline of the long-term triangle (red) near 1758.5, as the Fed announced they would begin tapering its bond buying program at a pace of $15 billion per month. This was not a surprise, as markets had been expecting this result. The move into the low was more of a “Sell the rumor, buy the fact” trade. Gold began moving higher as a result, and shorts were quickly stopped out. A few days later, on November 10th, the US released headline CPI at 6.1% YoY. Gold continued to move higher on expectations of higher inflation AND that the Fed wasn’t doing enough to slow the pace of the increase. Recall that until recently, the Fed had considered inflation to be “transitory”. Gold briefly moved about the upper trendline of the consolidating triangle (red), only to be rejected near 1877.5 .
Source: Tradingview, Stone X
Gold began moving lower again in the triangle, as no less than 4 Fed speaks hinted that the Fed may need to increase the pace of tapering bond purchases. If the pace of bond purchases increase, then inflation would lower. Thus, inflation expectations moved lower, which caused the price of Gold to move lower as well! When the Omicron variant of the coronavirus was first “announced”, Gold did indeed go bid from 1788.7 to resistance at 1815.6. However, sellers entered the market at resistance and pushed price lower as markets worried less and less about inflation. On Tuesday, Powell confirmed what the markets were already thinking: The increase in the pace of bond purchases may be ahead. Powell “retired” the word transitory. Gold initially sold off, however bounced back on a “sell the news, buy the fact” trade.
Where is Gold headed now?
With fears of higher inflation dwindling in the market, the direction of Gold will most likely be dependent on the Omicron variant. If data over the next 2 week shows that the virus will slow growth over the coming months, the price of Gold should increase. This may lead to lower expectations that the Fed will increase the pace of tapering at the next meeting, which would also push the price of Gold higher. However, if Omicron can be contained, the Fed should increase the taper, which would cause Gold to move lower.
Notice that price is approaching the apex of the triangle and consolidating at both the 50- and 200- Day Moving Averages at 1791. Resistance is at the recent highs near 1815.5. A close above would indicate a possible move back toward top trendline of the long-term triangle and recent highs near 1877. Horizontal resistance above there is at 1916.6. Support is at recent lows and the bottom, upward sloping trendline of the triangle near 1770. Below there is the previously mentioned long-term 61.8% Fibonacci retracement and horizontal support at 1721.72, then the triple bottom lows at 1678.9.
Gold has been consolidating towards the apex of a long-term triangle between 1770 and 1877. The next direction in Gold will depend on the Omicron variant and market expectations of how the virus may change the Fed’s thinking at the next meeting on December 15th and 16th.
Learn more about forex trading opportunities.
Latest market news
Yesterday 01:32 PM
Yesterday 09:35 AM
Yesterday 07:23 AM
Yesterday 04:48 AM
Yesterday 12:17 AM
July 25, 2024 10:39 PM
Latest Gold articles

Yesterday 09:35 AM

July 25, 2024 05:30 AM
July 23, 2024 05:20 PM
July 23, 2024 03:17 AM