

Asian Indices:
- Australia's ASX 200 index rose by 10.8 points (0.15%) and currently trades at 7,222.00
- Japan's Nikkei 225 index has risen by 179.91 points (0.66%) and currently trades at 27,459.71
- Hong Kong's Hang Seng index has fallen by -170.6 points (-0.8%) and currently trades at 21,244.60
- China's A50 Index has fallen by -24.91 points (-0.18%) and currently trades at 13,568.83
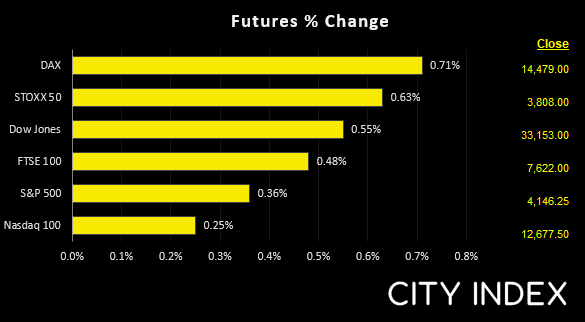
UK and Europe:
- UK's FTSE 100 futures are currently up 36.5 points (0.48%), the cash market is currently estimated to open at 7,644.16
- Euro STOXX 50 futures are currently up 25 points (0.66%), the cash market is currently estimated to open at 3,814.21
- Germany's DAX futures are currently up 102 points (0.71%), the cash market is currently estimated to open at 14,490.35
US Futures:
- DJI futures are currently up 183 points (0.56%)
- S&P 500 futures are currently up 34 points (0.27%)
- Nasdaq 100 futures are currently up 16 points (0.39%)
Yields continued to move higher overnight as bond markets felt the heat of rising oil prices, inflation and inflation expectations. This has been supportive of the US dollar which traders higher against all of its major peers, and the Japanese yen is the weakest major.
Australia’s GDP may have slowed in Q2 but grew faster than expected despite concerns that floods across parts of the country would dent growth. We also saw the Caixin services PMI contract but at a much slower pace, as it tracked the NBS reads seen yesterday.
Futures markets are pointing to a higher open with DAX and STOXX set to open around 0.6 -0.7% higher.
Commodities remain under pressure
Rising yields and a stronger US dollar continued to weigh on gold, which saw the prices finally pull themselves away from the 1850 area it has been meandering around since last week. Around current levels it is on track for a bearish engulfing week and momentum currently favours a move down towards the 1820 – 1822 support zone.
Oil prices made a mild attempt to retrace with WTI moving back above 115, but the potential for a bearish flag on the hourly chart is apparent. Should prices continue to drift higher then we’re looking out for bearish setups below 116.64.
BOC to hikes 50-bps, despite slower growth and cracks in the housing market
As things stand, the Bank of Canada are expected to hike rates by another 50-bps today and take their overnight cash rate to 1.5%. They’re also expected to hike for a third time in July by another 50-bps, before slowing down their pace at future meetings. But that also depends on whether we’ve seen peak inflation, which remains a hot topic as the 8.1% record inflation rate in the eurozone reignited fears that peak inflation has not yet been seen.
Canada’s GDP was softer than expected yesterday, which further highlights the delicate balance central banks must walk between fighting inflation at the cost of diminishing growth. So whilst we can expect another 100-bps of hikes over the next two meetings from the BOC, traders will keep a close eye on any hints that their current trajectory of hikes may be altered. Especially as Canada’s housing market is already feeling the strain from the hikes already seen.
FTSE grinds it way to key resistance
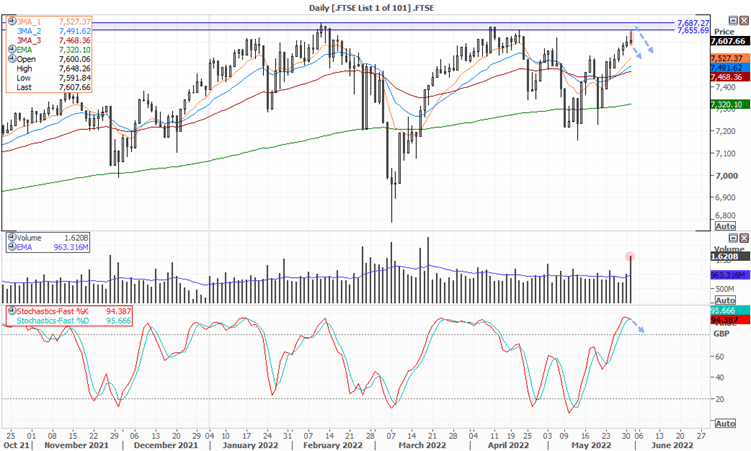
The FTSE has had a great run these past eight days when it rallied form the 200-day eMA. We had anticipated some mean reversion around 7600 but the index clearly had other ideas. However, the run is approaching key resistance levels and a high-volume bearish pinbar formed yesterday to warn of an impending top. Furthermore, the stochastic oscillator crossed beneath its signal line in the overbought zone.
Form here we are either looking for a strong break of yesterday’s low, or seek to fade into weakness below the resistance zone around 7655/87.
FTSE: Market Internals
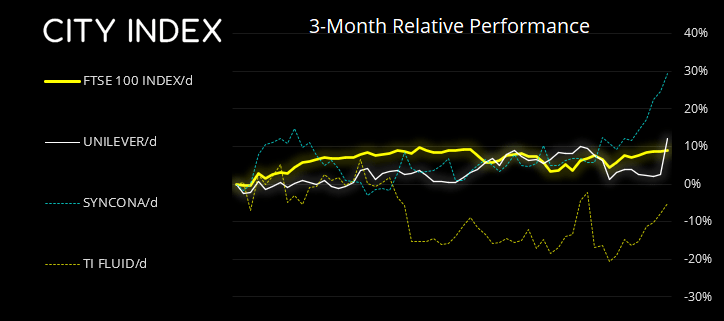
FTSE 350: 4237.22 (0.10%) 31 June 2022
- 103 (29.43%) stocks advanced and 238 (68.00%) declined
- 10 stocks rose to a new 52-week high, 2 fell to new lows
- 28.86% of stocks closed above their 200-day average
- 42.29% of stocks closed above their 50-day average
- 23.71% of stocks closed above their 20-day average
Outperformers:
- +9.43% - Unilever PLC (ULVR.L)
- +3.96% - Syncona Ltd (SYNCS.L)
- +3.05% - TI Fluid Systems PLC (TIFS.L)
Underperformers:
- -15.04% - B&M European Value Retail SA (BMEB.L)
- -8.64% - Trustpilot Group PLC (TRST.L)
- -5.62% - Wizz Air Holdings PLC (WIZZ.L)
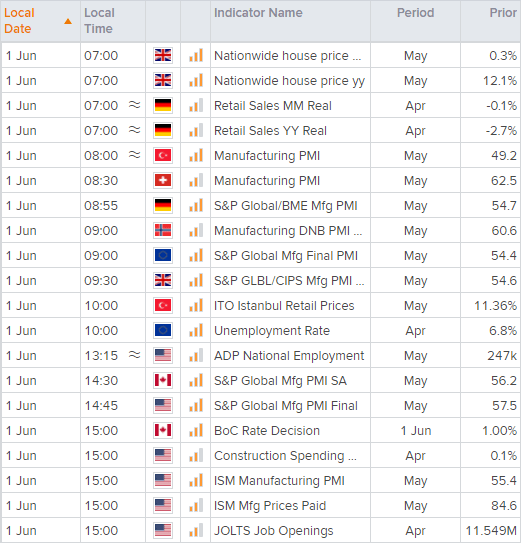
Up Next (Times in BST)
How to trade with City Index
You can easily trade with City Index by using these four easy steps:
-
Open an account, or log in if you’re already a customer
• Open an account in the UK
• Open an account in Australia
• Open an account in Singapore
- Search for the company you want to trade in our award-winning platform
- Choose your position and size, and your stop and limit levels
- Place the trade
How to trade with City Index
You can easily trade with City Index by using these four easy steps:
- Open an account, or log in if you’re already a customer
- Search for the company you want to trade in our award-winning platform
- Choose your position and size, and your stop and limit levels
- Place the trade
Latest market news
Yesterday 01:32 PM
Yesterday 09:35 AM
Yesterday 07:23 AM
Yesterday 04:48 AM
Yesterday 12:17 AM
July 25, 2024 10:39 PM
Latest Forex articles

Yesterday 12:17 AM

July 25, 2024 10:39 PM

July 25, 2024 03:59 PM

July 25, 2024 04:37 AM