March 24, 2022 3:48 PM

Investors who were unease about the ongoing Russia/Ukraine conflict now have even more to worry about. US President Joe Biden traveled to Europe this week to meet with NATO allies and discuss the situation. After the meeting, headlines released said that NATO is preparing for the risk of Russian nuclear incidents. In addition, Biden told NATO that he supports increased NATO troops on the Eastern front. Oh, and did I mention that the G-7 plans on warning Russia over its use of chemical and nuclear weapons? These comments will only increase the tensions between Russia and the West, causing further uncertainties. As a result, funds are flowing into the safe-haven asset of Gold.
Trade Gold (XAU/USD) now: Login or Open a new account!
• Open an account in the UK
• Open an account in Australia
• Open an account in Singapore
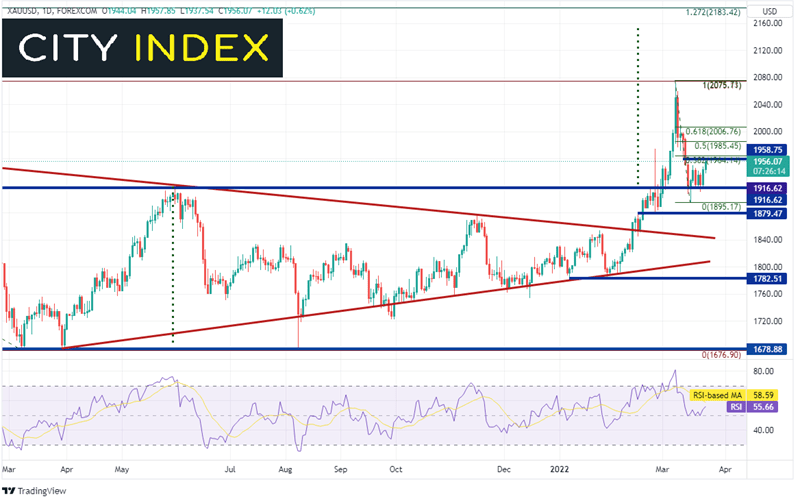
Gold had been in a symmetrical triangle since April 1st, 2021 before finally breaking above the top trendline of the pattern on February 11th near 1850. In addition, Gold had formed a double bottom in mid-2021 and broke above the neckline of the pattern on the day Russian invaded Ukraine, February 24th, near 1916. The target for the double bottom is near 2150.
Source: Tradingview, Stone X
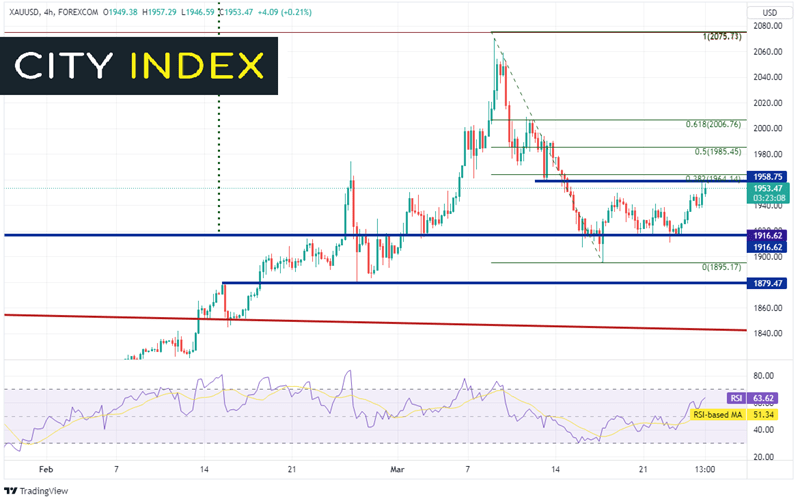
XAU/USD moved to a recent high of 2070.46 on March 8th, testing the all-time highs at 2075.11 from the summer of 2020. Since then, price pulled back and held support at the breakout of the double bottom pattern. On today’s headlines from NATO, price bounced into resistance near the low from March 11th at 1958.75. This is also near the double 38.2% Fibonacci retracement from the highs of March 8th to the lows of March 16th. Additional resistance is at the 50 % retracement and the 61.8% Fibonacci retracement from the same timeframe at 1985.45 and 2006.76, respectively. Support is at the March 16th lows near 1895.17, then horizontal support at 1879.47. If price breaks below there, the next level of support isn’t until the top, downward sloping trendline of the long-term triangle (see daily) near 1845.
Source: Tradingview, Stone X
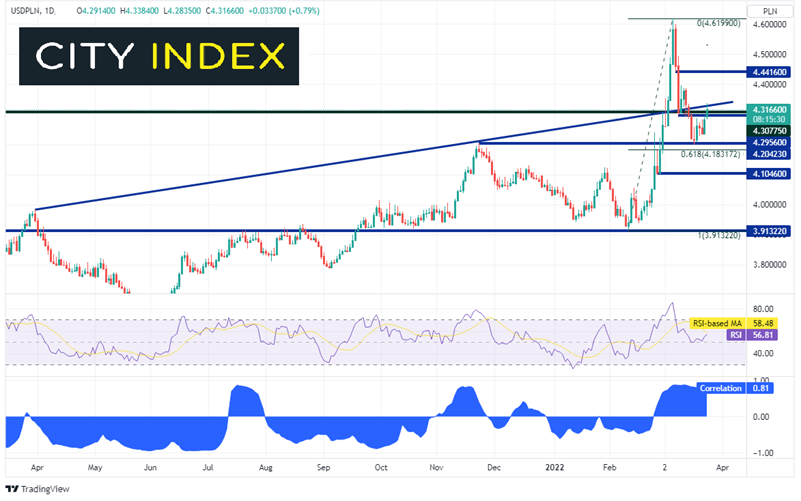
USD/PLN has a strong positive correlation with Gold. The current correlation coefficient between Gold and USD/PLN is +0.81. Any reading above +0.80 is considered strong. Just as with Gold, USD/PLN began moving aggressively higher after Russia invaded Ukraine, above previous all-time highs at 4.3078 on March 2nd. The pair continued higher and made a new all-time high on March 7th at 4.6199. Since then, USD/PLN pulled back to horizontal support at 4.2042 and has been moving higher since.
Source: Tradingview, Stone X
Trade USD/PLN now: Login or Open a new account!
• Open an account in the UK
• Open an account in Australia
• Open an account in Singapore
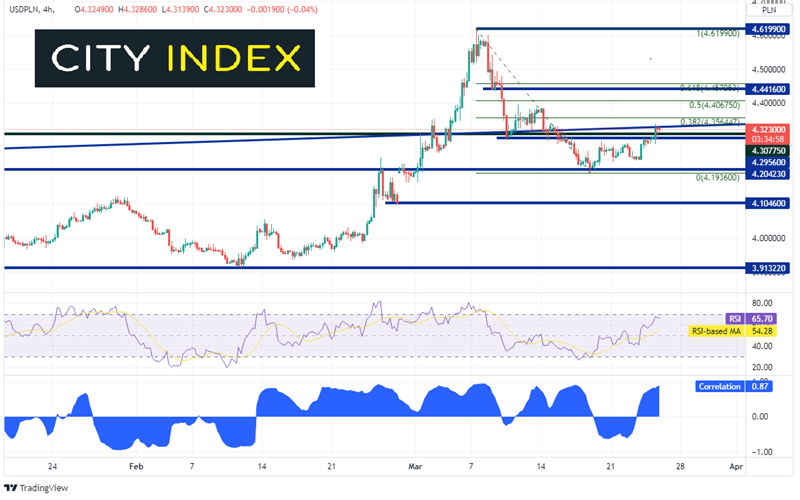
On a 240-minute timeframe, the correlation coefficient is even higher than on the daily at +0.87, USD/PLN is currently sitting at trendline resistance near 4.3384. A move above targets Fibonacci retracement levels from the highs of March 7th to the recent lows on March 17th, starting with the 38.2% level at 4.3565. Above there is the 50% retracement level and horizontal resistance at 4.4068 and 4.4416, respectively. Support is at the recent lows of 4.204 and the 61.8% Fibonacci retracement from the February 10th lows to the March 7th highs at 4.1832 (see daily).
Source: Tradingview, Stone X
Learn more about forex trading opportunities.
Latest market news
Yesterday 01:32 PM
Yesterday 09:35 AM
Yesterday 07:23 AM
Yesterday 04:48 AM
Yesterday 12:17 AM
July 25, 2024 10:39 PM
Latest Trade Ideas articles

Yesterday 09:35 AM

Yesterday 12:17 AM

July 25, 2024 10:39 PM

July 25, 2024 05:30 PM