November 15, 2022 9:23 PM

China had several economic data points released earlier today, and they weren’t good. Industrial Production for October fell from 6.3% YoY to 5% YoY. Expectations were for a drop to 5.2% YoY. In addition, October Retail Sales YoY fell to -0.5% YoY vs an expectation of +1.0% and a September reading of 2.5%. Fixed Asset Investment (YTD) for October fell to 5.8% in October vs 5.9% expected and 5.9% in September. Some feel that China is on its way towards a recession and today’s data supports that theory. Last week, China released poor CPI data (2.1% vs a previous reading of 2.8%). To help support the economy, China announced plans to step in to help the housing market and ease covid regulations for travelers and airlines entering the country. However, the PBOC stopped short of reducing is 1-Year MLF rate.
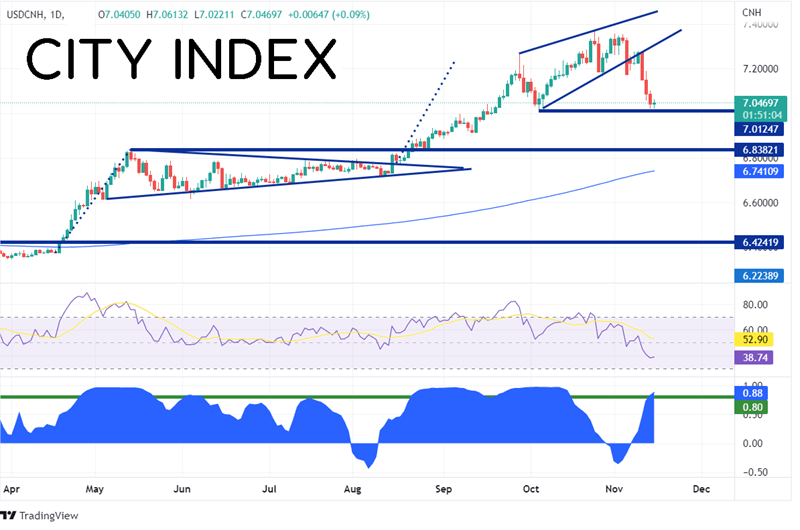
USD/CNH had been falling along with the recent slide in the US Dollar Index (DXY). As shown in the bottom panel of the chart below, the correlation between the USD/CNH and the DXY was strong during most of September and October. Readings above +0.80 are strong positive correlations. The two assets began to diverge at the end of October and early November. However, after US Payrolls were stronger than expected on November 4th, the correlation started moving back in-line. On November 9th, the correlation continued to gain strength as the US released weaker than expected CPI data. Today, the correlation moved back above the +0.80 level and is considered strong once again with a reading of +0.88.
Source: Tradingview, Stone X
In the chart above, the price of USD/CNH had been moving higher since the pair broke out of a pennant formation on August 15th. Price formed a local high on September 28th.near 7.2672. USD/CNH pulled back briefly, then continued moving higher in an ascending wedge formation. On November 4th, price broke below the wedge and pulled back to support today, near 7.0125.
Trade USD/CNH now: Login or Open a new account!
• Open an account in the UK
• Open an account in Australia
• Open an account in Singapore
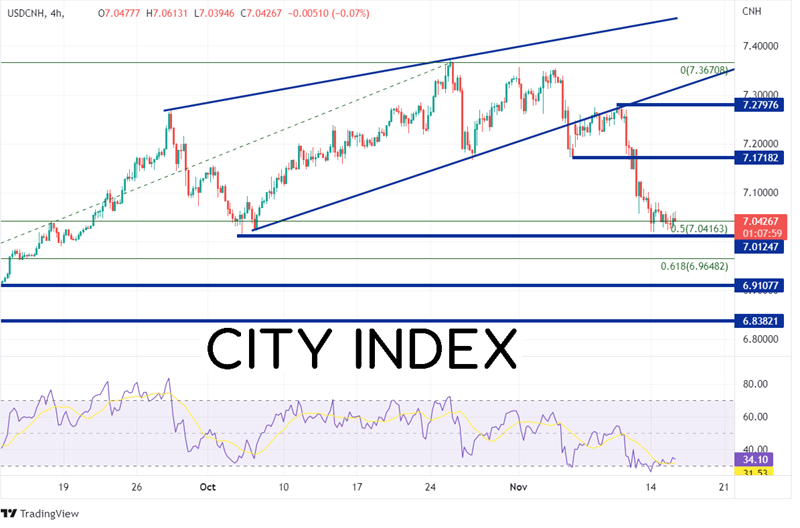
The expected retracement of the breakdown from a descending wedge is a 100% retracement. On a 240-minute timeframe, USD/CNH pulled back to the beginning of the ascending wedge and the 50% retracement level from the lows of August 10th to the highs of October 25th near 7.0416. If USD/CNH continues to move lower, the first support level is the 61.8% Fibonacci retracement level from the same timeframe at 6.9648. Below there, support crosses at the lows of September 12th near 6.9108, then the highs from May 13th at 6.8382. However, if support hold and price bounces, the first resistance level is the lows from November 4th at 7.1718, then the highs of November 9th at 7.2798. Just above there, the next resistance level is at the bottom trendline of the previous ascending wedge, near 7.3125.
Source: Tradingview, Stone X
The data release from China during the Asian session today was much worse than expected. USD/CNH halted its selloff and held support at support and a 50% retracement level. Will it hold and move higher? It may depend on how much the Chinese government is willing to further support the economy.
Learn more about forex trading opportunities.
Latest market news
Yesterday 01:39 PM
Yesterday 01:29 PM
Yesterday 12:16 PM
Latest Forex articles

Yesterday 01:39 PM

May 1, 2024 10:19 PM

May 1, 2024 04:50 PM

May 1, 2024 05:43 AM