November 7, 2022 8:38 PM

With many traders focused on last Friday’s Non-farm Payroll report from the US, Canada released jobs data of its own, and it was spectacular! The Employment Change for October from Canada was +108,000 vs an estimate of only +10,000 and a September reading of +21,100. Not only was the expected reading lower, but the actual print beat the expectation by nearly 11 times! This was the first time since February that Canada has added that many jobs. Even more impressive is that Canada added +119,000 full-time jobs! (This means that Canada lost 11,000 part-time jobs.) In addition, the Unemployment Rate in Canada during October remained at 5.2% vs an expectation of an uptick to 5.3%. The Bank of Canada only raised rates by 50bps at its last meeting to bring its overnight rate to 3.75% in October. Markets were expecting a rate hike of 75bps. However, the BOC noted that it will have to increase rates further as Core Inflation has still not showed any signs of easing. One has to consider that the October jobs print may make the Committee’s decision a little easier to hike by a more aggressive amount. However, the November Employment Change will be published on December 2nd just 5 days before the next BOC meeting. Another strong jobs report and the central bank could be more willing to bring the rate hike back up to 75bps!
Everything you wanted to know about the Bank of Canada
As a result of the larger than expected Employment Change on Friday, as well as a weaker US Dollar, USD/CAD broke the neckline of a head and shoulders pattern at 1.3502, and came within a few pips of reaching the 50% retracement level from the lows of September 13th to the highs of October 14th near 1.3466. There hasn’t been any follow-through on Monday in quiet trading. However, it seems as though traders may just be waiting for the next catalyst to push the pair lower. The target for a Head and Shoulders pattern is the distance from the head to the neckline, added to the breakdown point of the neckline. In this case, the target is near 1.3050.
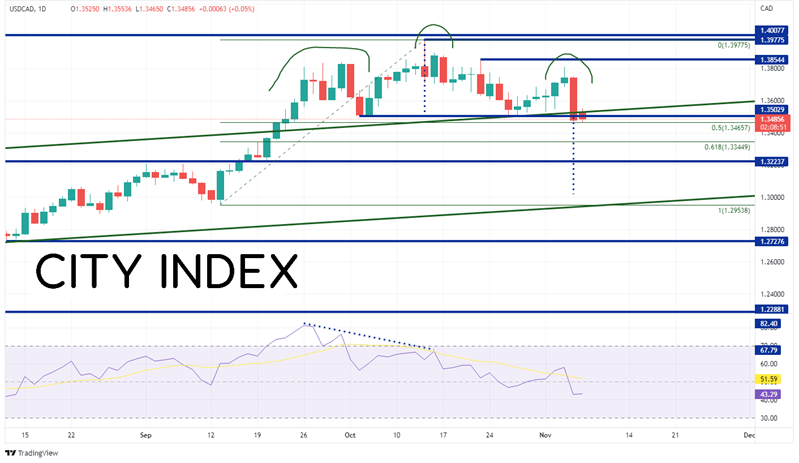
Source: Tradingview, Stone X
Trade USD/CAD now: Login or Open a new account!
• Open an account in the UK
• Open an account in Australia
• Open an account in Singapore
On a 240-minute timeframe, if price breaks below 1.3466, the next support is at the 61.8% Fibonacci retracement from the above-mentioned timeframe near 1.3345 and then horizontal support dating to July 14th at 1.3224. Just below the target at 1.3000 is the next psychological round number support level. However, if the 50% retracement holds, the first resistance level is the highs from November 3rd at 1.3808, then the highs form October 13th at 1.3978. If price moves above there, the next resistance level is at 1.4008, the highs from May 2020.
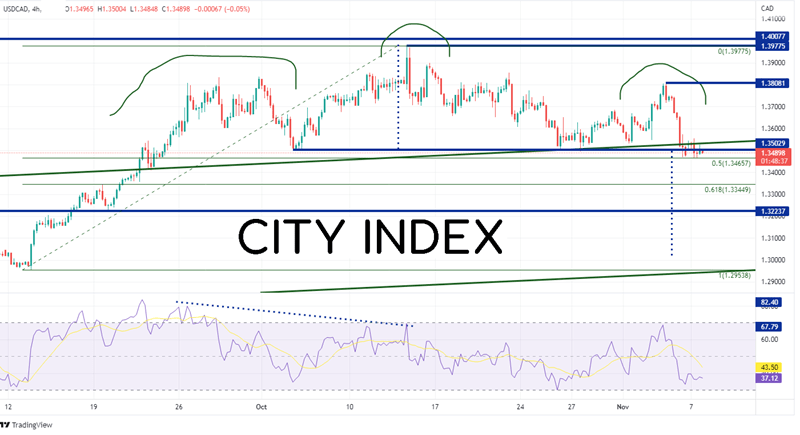
Source: Tradingview, Stone X
The strong Employment Change out of Canada in October may give the BOC a bit more confidence to raise rates in December. However, the meeting is a long way off. The committee will also have to digest a CPI print and another Employment Change before the next meeting occurs!
Learn more about forex trading opportunities.
Latest market news
Yesterday 01:32 PM
Yesterday 09:35 AM
Yesterday 07:23 AM
Yesterday 04:48 AM
Yesterday 12:17 AM
July 25, 2024 10:39 PM
Latest Forex articles

Yesterday 12:17 AM

July 25, 2024 10:39 PM

July 25, 2024 03:59 PM

July 25, 2024 04:37 AM