September 9, 2022 4:27 PM

Canada’s August Employment change couldn’t be much worse. Canada lost 39,700 jobs in August vs an expectation of +15,000 and a loss of 30,600 jobs in July. To make matters worse, the number of full time jobs decreased by 77,200! Part time jobs increased by 37,500. This is the third month in a row Canada has had a headline print worse than -30,000 jobs, bringing the 3-month total to -113,500 jobs! But the biggest headline shock may be in the Unemployment Rate, which jumped from 4.9% in July to 5.4% in August! Expectations were for a slight uptick to 5.0%.
The natural question to ask now, is “Are higher interest rates to blame for the slowdown in the jobs market?” Like many developed markets around the world, Canada has been hiking interest rates at an aggressive pace. In July, the BOC became one of the most aggressive central banks by hiking rates 100bps. Then on Wednesday, the central bank hiked an additional 75bps to bring the overnight rate to 3.25%. This is in addition to the on-going Quantitative Tightening program. The BOC also said there will be more rate hikes to come. But how many more jobs is the BOC willing to lose before it decides to slow down the pace of hiking?
Everything you need to know about the Bank of Canada
USD/CAD has been moving higher in an orderly channel since early April. On July 14th, the pair reached a high of 1.3224, while testing the top trendline of the channel. USD/CAD pulled back in a descending wedge formation and tested the opposite side of the channel on August 11th, near 1.2728. After price broke out of the descending wedge, it once again began to move higher. On September 1st and September 7th, USD/CAD tested the July 14th highs, reaching 1.3209, however failed both times. Price pulled back today to an intraday low of 1.2982, just above the 50% retracement level from the lows of August 11th to the highs of September 7th.
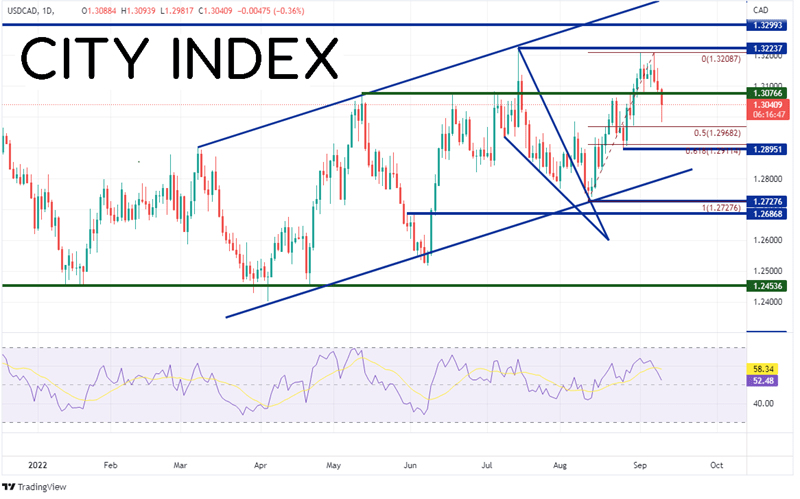
Source: Tradingview, Stone X
Trade USD/CAD now: Login or Open a new account!
• Open an account in the UK
• Open an account in Australia
• Open an account in Singapore
On a 240- minute timeframe, USD/CAD formed a double top formation when price broke below the neckline at 1.3077, which has acted as support and resistance multiple times since May. If price is to continue to the target of 1.2840, it must first break through the previously mentioned 50% retracement level at 1.2968. If price does reach the target, it can then fall to the 61.8% Fibonacci retracement level from the same timeframe near 1.2911 and then the August 25th lows at 1.2895. However, if price bounces, the first level of resistance is at the neckline of the double top near 1.3077, then the September 7th highs at 1.3209. If price breaks above there, it can test the July 14th highs at 1.3224.
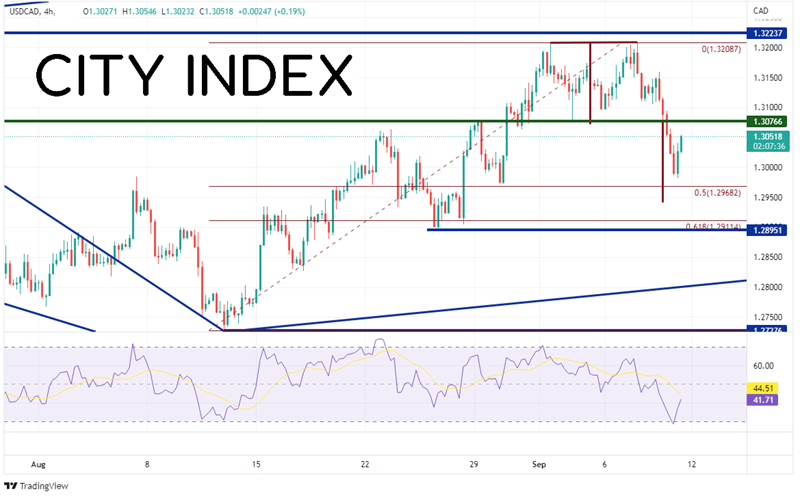
Source: Tradingview, Stone X
The Canadian Employment Change for August was -39,700 bringing the 3-month total to -113,500. Is it due to the BOC raising interest rates too quickly? The BOC said on Wednesday that there are more hikes to come. If the central bank continues to hike interest rates at such an aggressive pace, will it lead to more job losses for Canada?
Learn more about forex trading opportunities.
Latest market news
Yesterday 01:32 PM
Yesterday 09:35 AM
Yesterday 07:23 AM
Yesterday 04:48 AM
Yesterday 12:17 AM
July 25, 2024 10:39 PM
Latest Forex articles

Yesterday 12:17 AM

July 25, 2024 10:39 PM

July 25, 2024 03:59 PM

July 25, 2024 04:37 AM