March 23, 2022 2:40 PM

The BOJ is clearly in the dovish camp, as it still tries to dig out from the effects of the coronavirus. In addition, the Bank of Japan revised down its economic outlook as commodity prices are surging, particularly in oil. Not to mention that because the economy still needs help, Prime Minister Kishida has put together a supplemental budget worth roughly JPY 10 trillion. Therefore, it would make sense that the yen is performing so weak.
Meanwhile the US Federal is in hiking mode. Last week the FOMC hiked the Fed Funds rate by 25bps to 0.50% and said there is more to come. Speaking on Tuesday, Fed Chairman Powell delivered his most hawkish comments yet. He said that “if we conclude that it is appropriate to move more aggressively by raising the Federal Funds rate by more than 25bps at a meeting, or meetings, we will do so.” In addition to these comments, other Fed officials have insinuated that the Fed wants to get to neutral as soon as possible, which in this case is around 2.25%. Markets are currently pricing in 190bps worth of hikes for this year, which would mean not 1, but 2 hikes of 50bps this year.
Everything you need to know about the Federal Reserve
On a monthly timeframe, USD/JPY has been in a symmetrical triangle since January 2002 and is currently banging up against the top trendline of the triangle. Notice that the RSI is in overbought territory, an indication that the pair may be ready to pull back on the monthly chart.
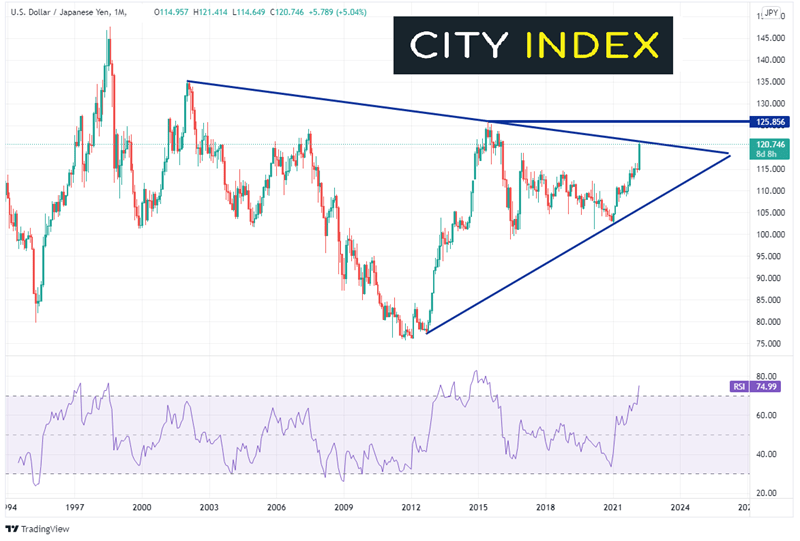
Source: Tradingview, Stone X
On a weekly timeframe, if price does break above the monthly trendline, horizontal resistance sits at 122.26, then the highs from June 2015 at 125.85. However, notice on the weekly timeframe that the RSI is overbought as well. Therefore, USD/JPY may be ready for a pullback. Horizontal support sits at the breakout above recent highs at 116.35 and the previous highs from February 2020 at 112.23.
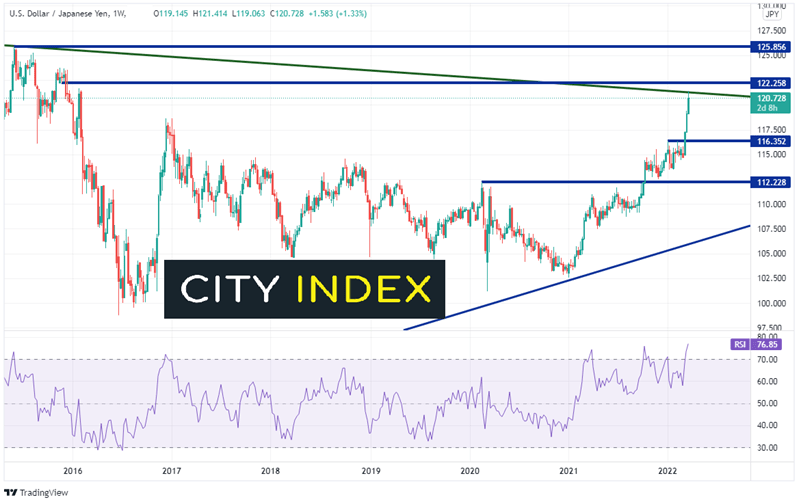
Source: Tradingview, Stone X
Trade USD/JPY now: Login or Open a new account!
• Open an account in the UK
• Open an account in Australia
• Open an account in Singapore
The BOE also hiked rates last week by 25bps to 0.75% and may have more to come. Inflation released on Wednesday showed that headline inflation for February was 6.2% YoY vs and expectation of 5.9% YoY and 5.5% YoY in January. The central bank said it sees inflation topping out at 8%, while in his Spring Statement, Chancellor of the Exchequer Rishi Sunak said that he expects inflation for 2022 to be at 7.4%. Markets expect at hike at the next BOE meeting on May 5th, and it is currently pricing in nearly a 40% chance of a 50bps hike.
Everything you need to know about the Bank of England
On a monthly timeframe, GBP/JPY recently broke above a long-term downward sloping trendline dating to July 2007. In addition, the pair is testing the 50% retracement level from the highs of June 2015 to the lows of March 2020, near 159.97.
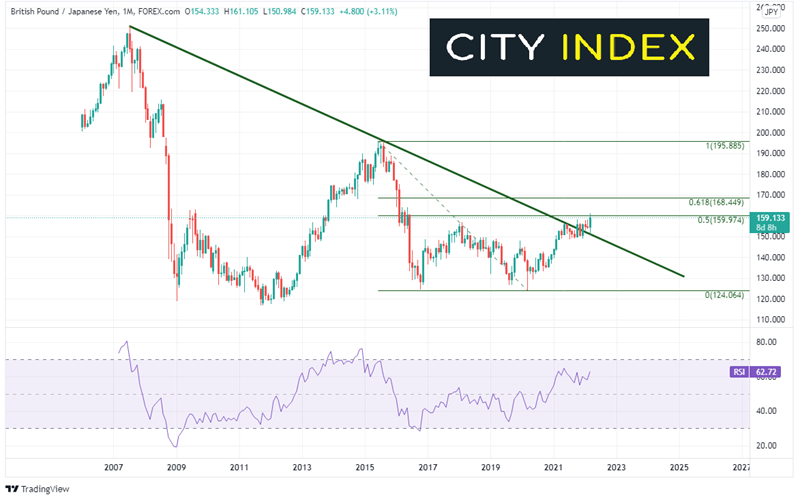
Source: Tradingview, Stone X
On a weekly timeframe, if price can close the week above 159.97, the next resistance is at the 61.8% Fibonacci retracement from the recently mentioned timeframe and horizontal resistance between 168.02 and 168.45. First support is at the near-term previous highs of 158.22 then down at the long-term trendline (from the monthly) near 150.00. Below there, price can fall to horizontal support at 147.96.
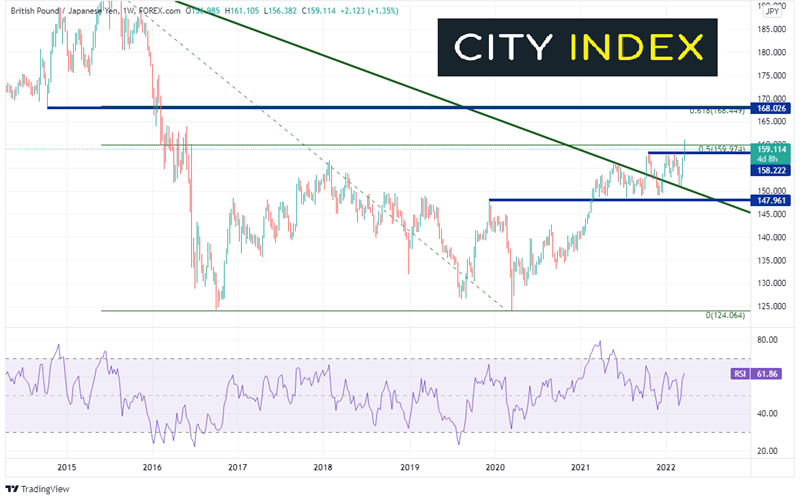
Source: Tradingview, Stone X
Trade GBP/JPY now: Login or Open a new account!
• Open an account in the UK
• Open an account in Australia
• Open an account in Singapore
With BOJ monetary policy diverging from that of the Fed and the BOE, USD/JPY and GBP/JPY have been on a tear lately. However, both are running into significant resistance levels on the longer-term charts, with an overbought RSI on USD/JPY. Will the pairs move higher? They may pause at resistance, but If they can close above it on the monthly timeframe, both pairs have room to run.
Learn more about forex trading opportunities.
Latest market news
Yesterday 01:32 PM
Yesterday 09:35 AM
Yesterday 07:23 AM
Yesterday 04:48 AM
Yesterday 12:17 AM
July 25, 2024 10:39 PM
Latest Trade Ideas articles

Yesterday 09:35 AM

Yesterday 12:17 AM

July 25, 2024 10:39 PM

July 25, 2024 05:30 PM