

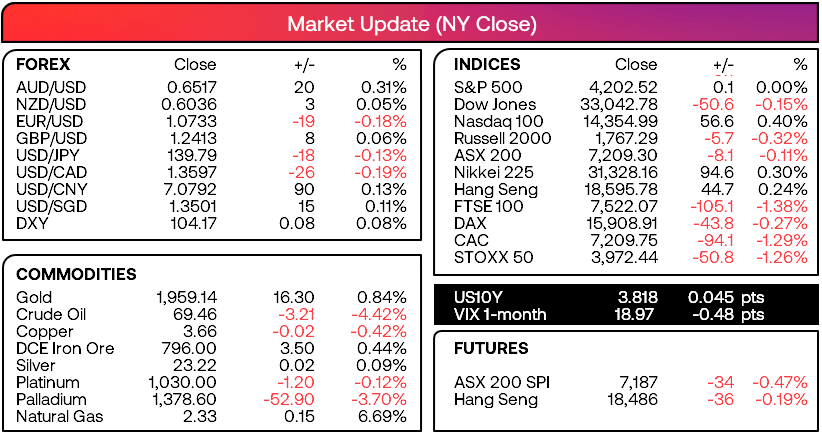
Market summary
- The Republican House of Representatives are set to vote today on whether to pass the debt-ceiling bill on to the Democratic Senate
- Both Biden and McCarty continue to claim they have enough votes, but that doesn’t mean we should not rule out a surprise bump in the road along the way to potentially derail the deal and spark a bout of risk-off for markets (which could send risk assets such as indices, AUD/JPY lower and gold higher)
- A bearish outside day formed on the US dollar index to suggest a near-term inflection point at the highs
- EUR/USD found support with a bullish engulfing day at the 200-day EMA / 50-week EMA / 20-month EMA
- USD/CAD formed a bullish hammer day at the 20-day EMA, AUD/USD formed a bearish engulfing day
- Australian building approvals fell -8.1% in April, below 2% expected
- Australia’s Treasury Secretary warns that the economy may be entering a period of poor growth, although inflationary pressures are expected to diminish from here
- Expectations are for China’s PMIs to contract again, according to a Bloomberg survey (which could potentially weigh on AUD today, if weak enough)
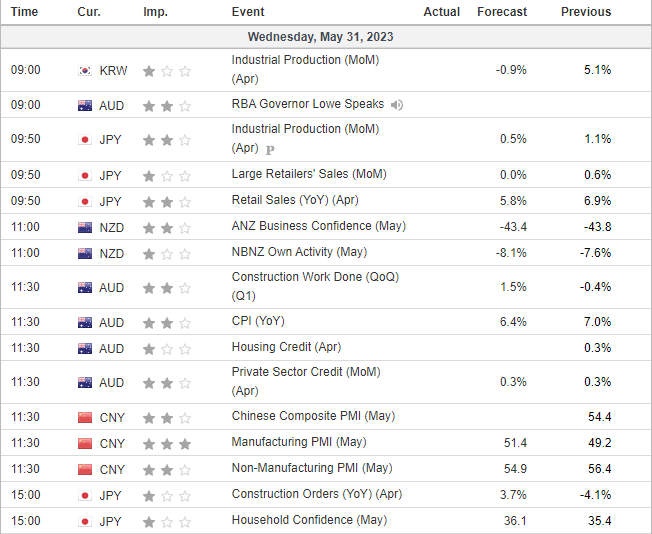
- Keep an eye on comments from RAB Governor Lowe who speaks at 09:00 AEDT, as traders try to decipher whether the RBA will hike again or pause at their June meeting
- However, the key data point for AU traders is the monthly inflation report at 11:30 AEDT
Events in focus (AEDT):
- 09:00 - RBA Lowe speaks
- 09:50 – Japan’s retail sales, industrial production
- 1100 – New Zealand business confidence
- 11:30 – Australian inflation, China’s PMI (manufacturing, services and composite from NBS)
ASX 200 at a glance:
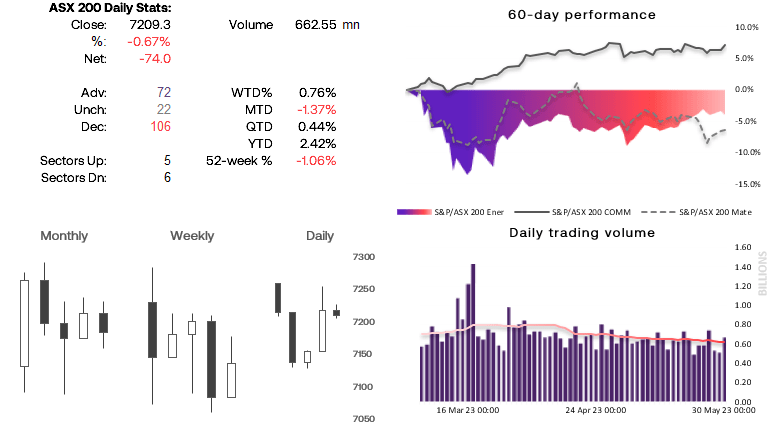
- Lowest daily range in six weeks
- 20-day EMA capped as resistance
- Price action on the intraday timeframe appears to be corrective
- SPI futures point to a slightly lower open of ~0.47%
- However, a 3-day bullish reversal formed on the daily chart on Monday (morning star reversal)
- Now looking for evidence of a swing low and move to 7300
AUD/USD 1-hour chart:
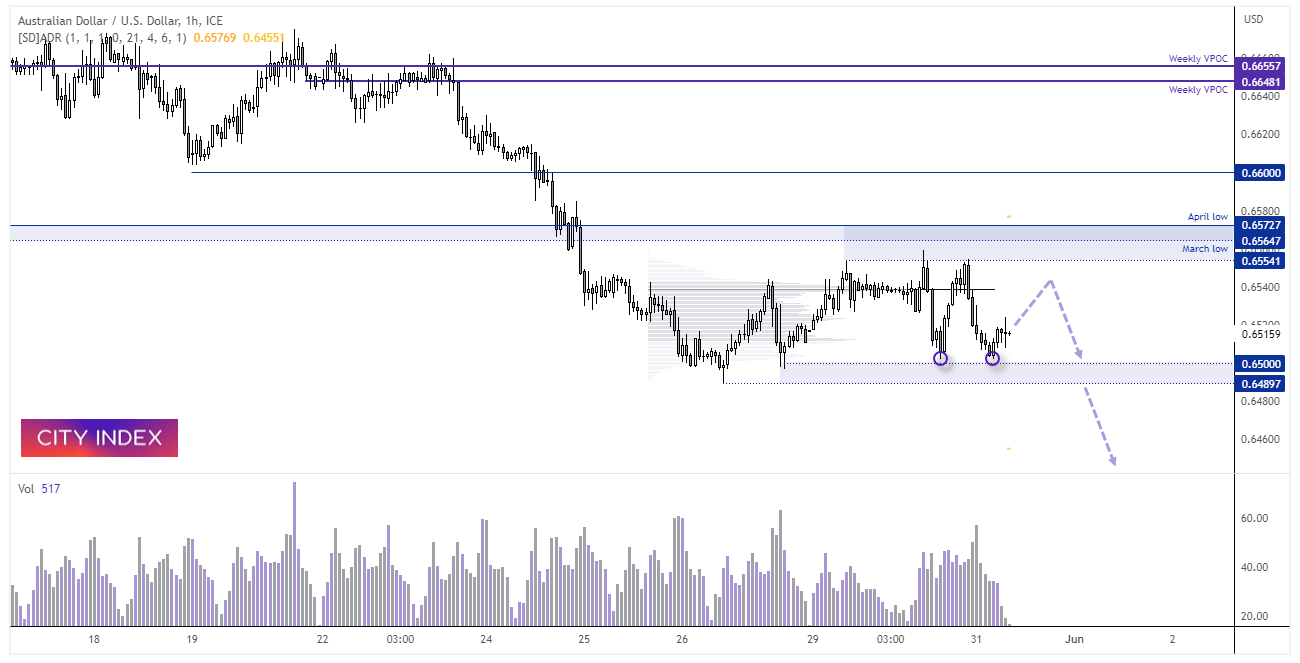
The Aussie printed a bearish engulfing day near the cycle lows to suggest it wants to break lower and extend its bearish trend. However, we’ve seen a bit of a shakeout around the lows, with a double bottom formed above 0.6500 with elevated volumes, which suggests demand around this level and the potential for a bounce. The most traded price within the sideways range is 0.6540, which could act as a magnet for a move high – at which point we would seek for evidence of a swing high up to the March / April lows for another leg lower.
Asia Data Calendar (AEDT):
-- Written by Matt Simpson
Follow Matt on Twitter @cLeverEdge
How to trade with City Index
You can trade with City Index by following these four easy steps:
-
Open an account, or log in if you’re already a customer
• Open an account in the UK
• Open an account in Australia
• Open an account in Singapore
- Search for the market you want to trade in our award-winning platform
- Choose your position and size, and your stop and limit levels
- Place the trade
Latest market news
Yesterday 01:32 PM
Yesterday 09:35 AM
Yesterday 07:23 AM
Yesterday 04:48 AM
Yesterday 12:17 AM
July 25, 2024 10:39 PM
Latest Trade Ideas articles

Yesterday 09:35 AM

Yesterday 12:17 AM

July 25, 2024 10:39 PM

July 25, 2024 05:30 PM